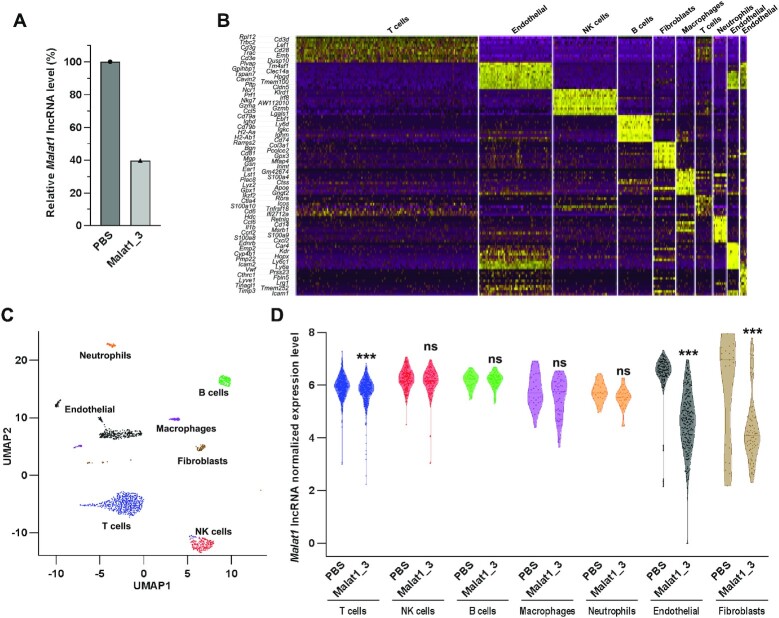
Figure 4.
scRNA-seq analysis of mouse lung after intratracheal administration of LNA gapmer ASO targeting Malat1. Mice were intratracheally administered 7.5 nmol (∼1.6 mg kg–1) of ASO or PBS (n = 1), and lungs were collected after 2 days. A small piece of mouse lung (30 mg) was collected for RNA isolation, and single cells were isolated from the rest of the lung using flow cytometric sorting. Isolated cells were subjected to scRNA-seq analysis (867 cells in PBS and 970 cells in the ASO-treated group). (A) Silencing of Malat1 lncRNA in bulk lung tissue was measured by RT-qPCR and normalized with Ppib mRNA expression. Data are presented relative to the PBS group. (B) Heatmap of differentially expressed genes between each clustered cell type (both treatment groups combined). (C) Annotation of algorithmically identified lung cell clusters (both treatment groups combined). (D) The normalized expression level of Malat1 lncRNA in each cell type. Data are presented as violin plot with the median as mid-line and values of the individual cell as dots. ***False discovery rate (FDR)-adjusted P < 0.001 versus the PBS group.

