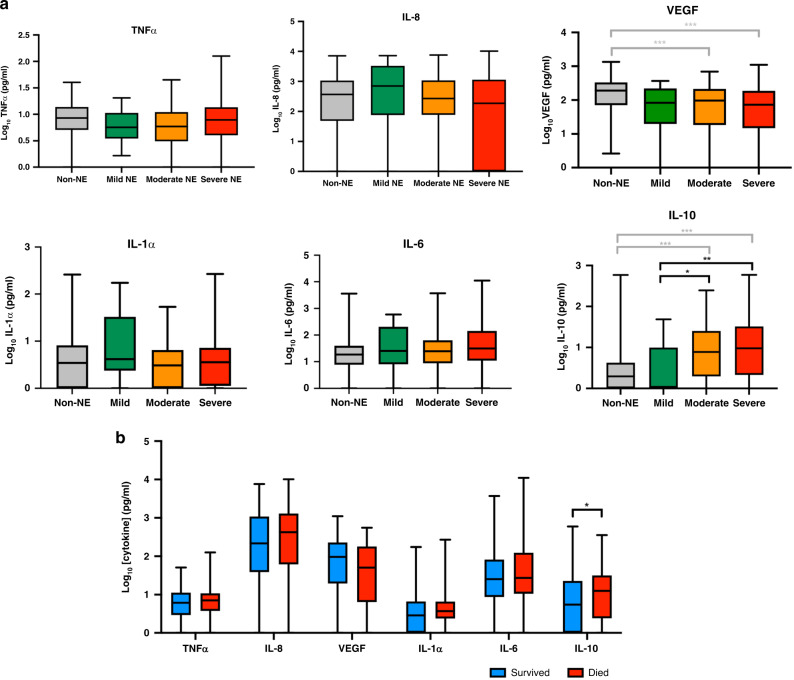
Fig. 2. Cytokine profiles and neonatal outcomes.
a Comparison of cytokine levels (pg/ml) between non-NE infants and NE infants by severity of NE (according to the highest modified Sarnat score in the first 5 days of life). b Comparison of cytokine levels (pg/ml) between infants with NE who survived or died in the first 28 days of life. Box plots showing the median, interquartile range, and range of the data. Differences between groups were compared using Kruskal–Wallis test *p < 0.05, **p < 0.01, and ***p < 0.001.

