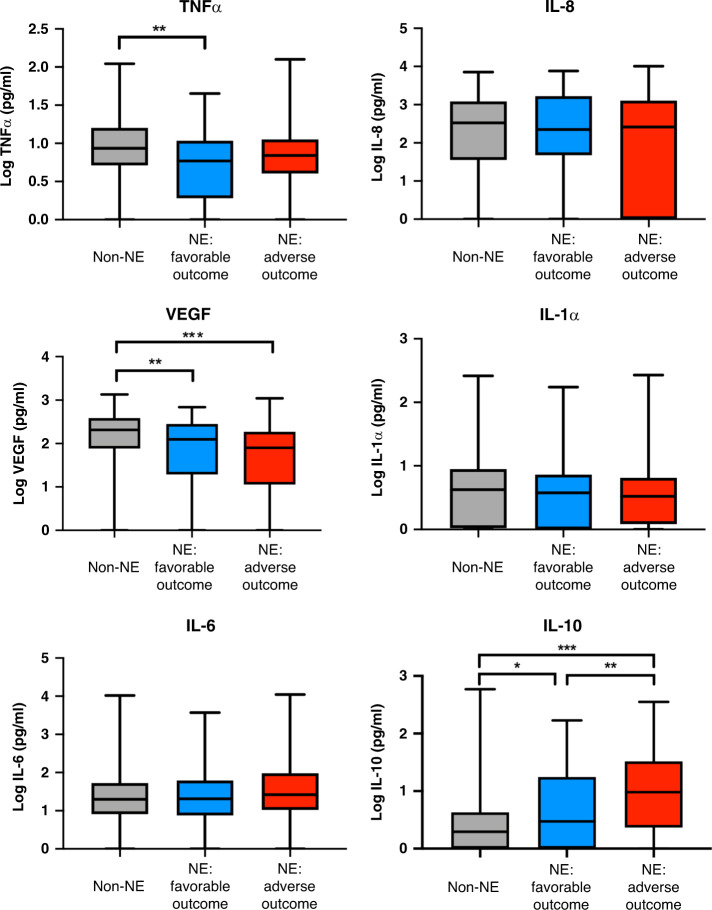
Fig. 3. Cytokine profiles and early childhood outcomes.
Cytokine levels (pg/ml) in non-NE infants, NE infants with favorable outcomes, and NE infants with adverse outcomes. Adverse outcomes defined as death or neurodevelopmental impairment (global DQ < 70 on GMDS and/or HINE score <67 and/or diagnosis of CP at 1–2 years). Box plots showing the median, interquartile range, and range of the data. Differences between groups were compared using Kruskal–Wallis test where *p < 0.05, **p < 0.01, and ***p < 0.001.

