Fig. 1.
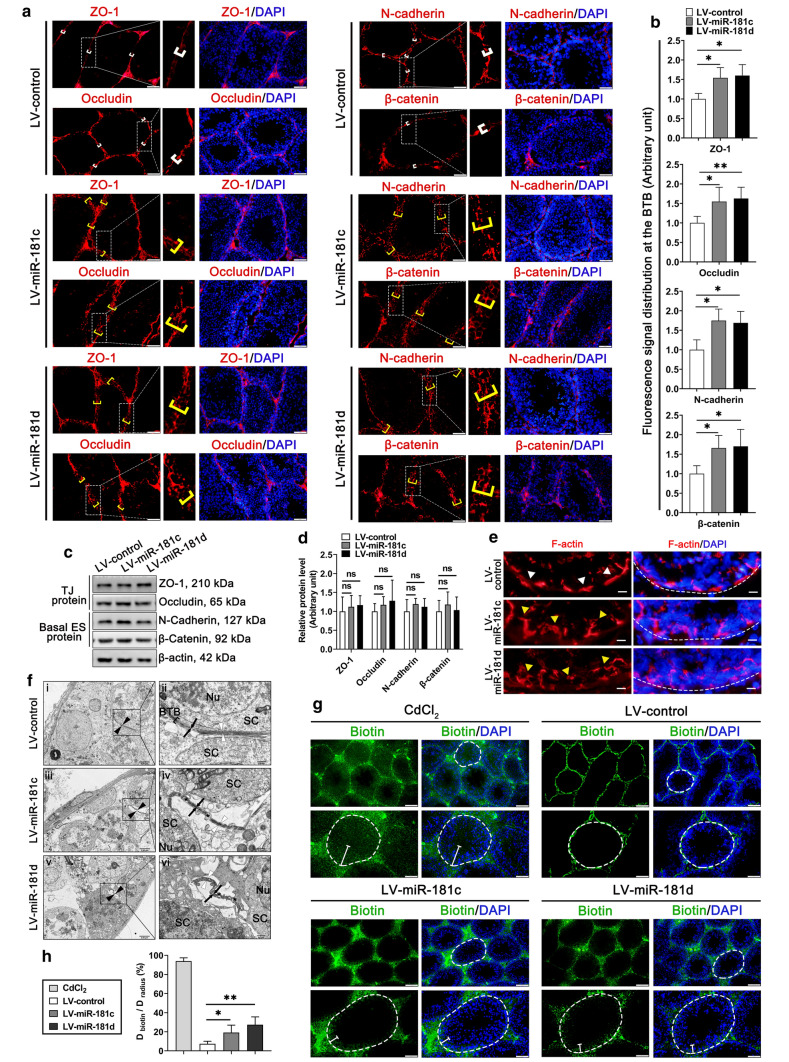
LV-miR-181c/d administration perturbs the BTB function in vivo. Mice were analyzed at 2 weeks post the final LV-miR-181c/d administration. a Immunofluorescence staining of TJ proteins (ZO-1, Occludin) (red) and basal ES proteins (N-cadherin, β-catenin) (red) in testes (n = 3). These proteins are tightly localized at the BTB (white brackets) or diffusely localized at the BTB (yellow brackets) near the basement membrane. Scale bars: 50 μm and 10 μm. b Quantification of fluorescence signal distributed at the BTB. c Western blot analysis of TJ proteins and basal ES proteins in testes. The quantification of protein level is shown in the bar graph (d). e F-actin staining (red) in mouse testis sections (n = 3). In LV-miR-181c/d mice, F-actin is no longer lined up properly along the BTB (yellow arrowheads) as found in the LV-control mice (white arrowheads). Scale bar: 10 μm. f TEM ultrastructural analysis of mouse testis (n = 3). Black arrowheads represent the interface of two SCs; black arrows represent the TJs structure. In the LV-control mice, white arrowheads represent the normal actin bundles. In LV-miR-181c/d mice, white arrowheads represent the dissolved actin bundles; asterisks represent the swollen intercellular space between adjacent SCs. Nu, nucleus; SC, Sertoli cell. Scale bars: 2.5 μm (i, iii, v), 0.5 μm (ii, iv, vi). g In vivo BTB integrity assay (n = 3). CdCl2-treated mice were used as positive controls. Disruption of the BTB is reflected by diffusion distance (white segments) of the indicator from the basal lamina (white broken circles) to the tubule lumen. Scale bars: 100 and 50 μm. h Histogram illustrating results of the BTB integrity assay. Data are presented as mean ± SD of at least three independent experiments. *p < 0.05; **p < 0.01; ns, not significant

