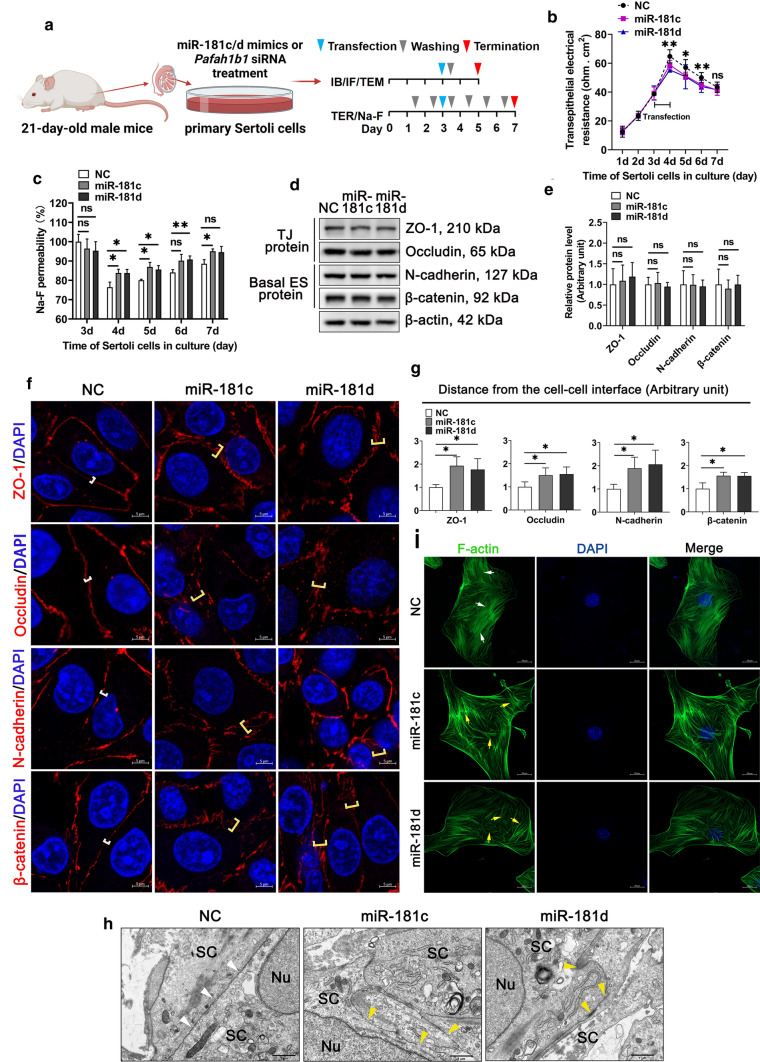
Fig. 2.
miR-181c/d overexpression disturbs the Sertoli cell barrier in vitro. Primary murine Sertoli cells (SCs) were transfected with mimics NC or miR-181c/d mimics. miR-181c mimics, miR-181d mimics, and mimics NC are abbreviated to miR-181c, miR-181d, and NC, respectively. a Schematic illustration of the treatment regimen. b, c The permeability of the Sertoli cell barrier was assessed in vitro by quantifying TER (b) or measuring the permeability of Na-F (c) in miR-181c/d mimics treated murine SCs. d Western blot analysis of TJ proteins and basal ES proteins in miR-181c/d mimics treated murine SCs. The quantification of protein level is shown in the bar graph (e). f Immunofluorescence staining of TJ proteins (red) and basal ES proteins (red) in miR-181c/d mimics treated murine SCs. These proteins are tightly localized (white brackets) or diffusively localized (yellow brackets) at the Sertoli cell–cell interface. Scale bar: 5 μm. g Quantification of fluorescence signal distributed at the cell–cell interface. h TEM ultrastructural analysis in miR-181c/d mimics treated murine SCs. Intact (white arrowheads) or disrupted (yellow arrowheads) TJ structures between adjacent murine SC contact. Scale bar: 1 μm. Nu, nucleus; SC, Sertoli cell. i F-actin staining (green) in miR-181c/d mimics treated murine SCs. Ordered (white arrows) or disordered (yellow arrows) F-actin are indicated. Scale bar: 20 μm. Data are presented as mean ± SD of at least three independent experiments. *p < 0.05; **p < 0.01; ns, not significant

