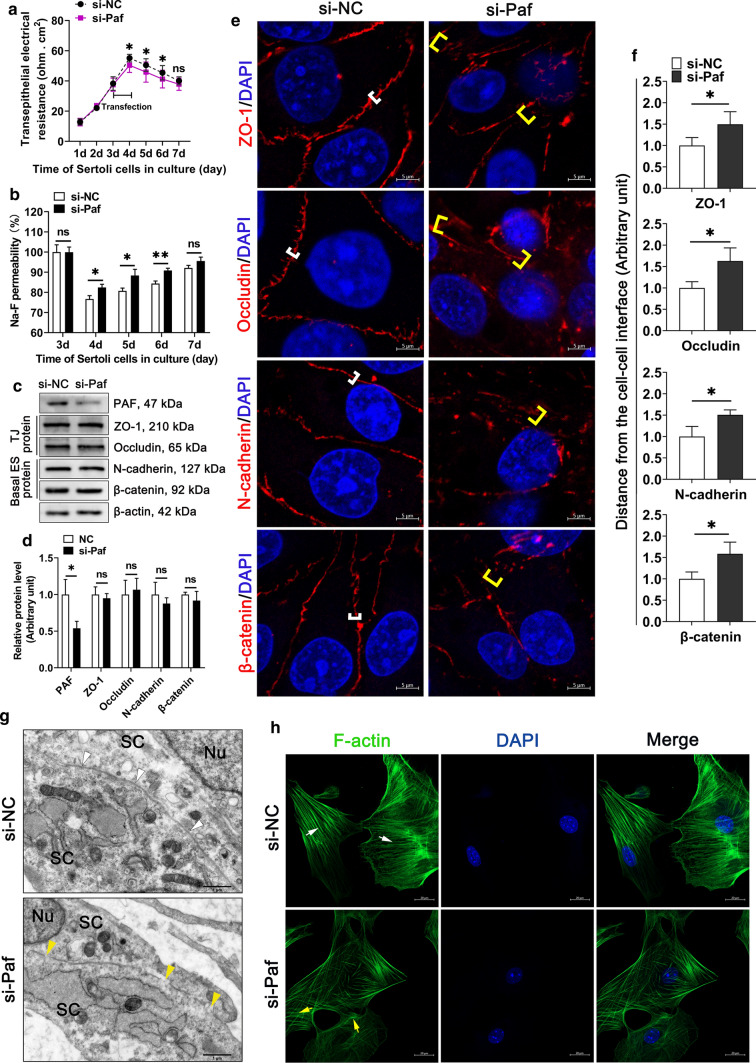
Fig. 4.
Inhibition of Pafah1b1 disturbs the Sertoli cell barrier in vitro. The murine SCs were transfected with NC siRNA or Pafah1b1 siRNA. NC siRNA and Pafah1b1 siRNA are abbreviated to si-NC and si-paf, respectively. a, b The permeability of the Sertoli cell barrier was assessed in vitro by quantifying TER (a) or measuring the permeability of Na-F (b) in Pafah1b1 siRNA treated murine SCs. c Western blot analysis of TJ proteins and basal ES proteins in Pafah1b1 siRNA treated murine SCs. The quantification of protein level is shown in the bar graph (d). e Immunofluorescence staining of TJ proteins (red) and basal ES proteins (red) in Pafah1b1 siRNA treated murine SCs. These proteins are tightly localized (white brackets) or diffusively localized (yellow brackets) at the Sertoli cell–cell interface. Scale bar: 5 μm. f Quantification of fluorescence signal distributed at the cell–cell interface. g TEM ultrastructural analysis in Pafah1b1 siRNA treated murine SCs. Intact (white arrowheads) or disrupted (yellow arrowheads) TJ structures between adjacent murine SC contact. Scale bar: 1 μm. Nu, nucleus; SC, Sertoli cell. h F-actin staining (green) in Pafah1b1 siRNA treated murine SCs. Ordered (white arrows) or disordered (yellow arrows) F-actin are indicated. Scale bar: 20 μm. Data are presented as mean ± SD of at least three independent experiments. *p < 0.05; **p < 0.01; ns, not significant

