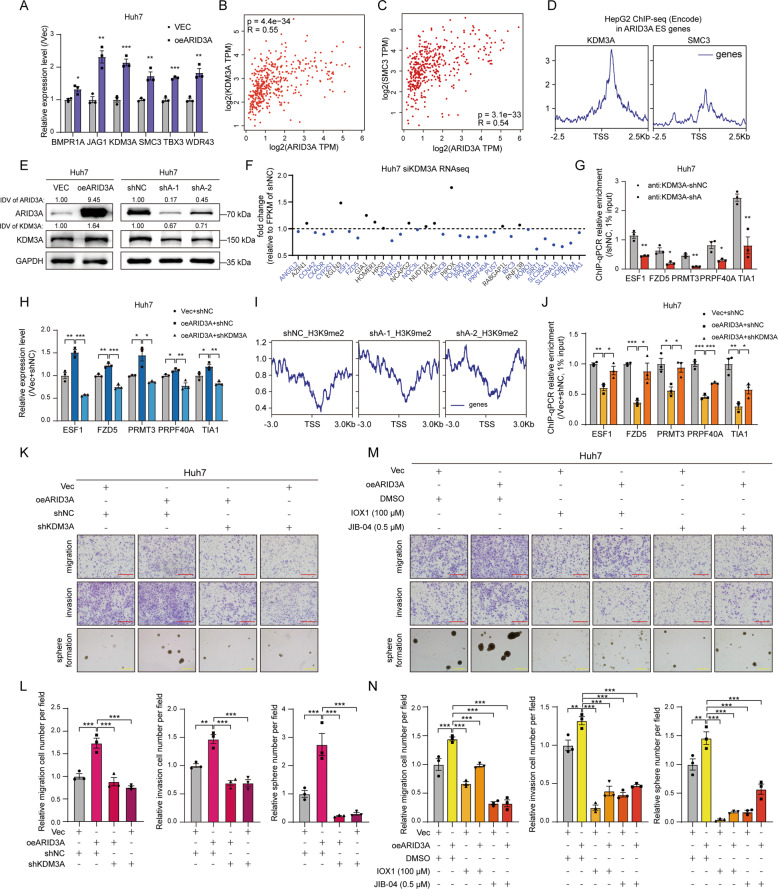
Fig. 4. ARID3A activates ES signature genes expression through H3K9me2 demethylation by KDM3A.
A The mRNA expression levels of stem cell population maintenance genes were determined by qPCR in Huh7 cells after ARID3A overexpression. n = 3 biologically independent experiments, two-tailed Student’s t-test. B, C Correlations between KDM3A (B) or SMC3 (C) expression and ARID3A expression in TCGA-LIHC (tumour and normal) were determined from the GEPIA database by Spearman’s rank correlation analysis. D Genomic occupancy profile of KDM3A (ENCODE: ENCSR387JKT) and SMC3 (ENCODE: ENCSR000EDW) in the TSS regions of the ARID3A-associated ES genes in HepG2 cell ChIP-seq data. E KDM3A protein expression levels were determined by western blot analysis in Huh7 cells after ARID3A overexpression or knockdown. The integrated density value (IDV) was calculated by ImageJ and normalized to the internal control. F Relative mRNA levels of KDM3A-related ARID3A-associated ES genes in KDM3A knockdown Huh7 cells (vs. siNC cells) were determined by RNA-seq. G The KDM3A occupancy levels in the promoters of representative ARID3A-associated ES signature genes were determined by ChIP-qPCR in ARID3A knockdown Huh7 cells (vs. shNC cells). n = 3 biologically independent experiments, two-tailed Student’s t-test. H The mRNA levels of representative ARID3A-associated ES genes in Huh7 cells treated as indicate. n = 3 biologically independent experiments, one-way ANOVA with Tukey’s multiple comparison test. I Genomic occupancy profile of H3K9me2 in the TSS regions of ARID3A-associated ES genes in ARID3A knockdown Huh7 cells (vs. shNC cells). J The H3K9me2 occupancy levels in the promoters of representative ARID3A-associated ES genes were determined by ChIP-qPCR after the indicated treatments. n = 3 biologically independent experiments, one-way ANOVA with Tukey’s multiple comparison test. K, L Transwell and tumoursphere formation assays were performed in Huh7 cells treated as indicated (red scale bar, 150 μm, yellow scale bar, 300 μm). n = 3 biologically independent experiments, one-way ANOVA with Tukey’s multiple comparison test. M, N Transwell and tumoursphere formation assays were performed in ARID3A-overexpressing Huh7 cells treated with the KDM3A inhibitors IOX1 and JIB-04 at the indicated concentrations (red scale bar, 150 μm, yellow scale bar, 300 μm). n = 3 biologically independent experiments, one-way ANOVA with Tukey’s multiple comparison test. The values are expressed as the means ± SEMs; *p < 0.05, **p < 0.01, and ***p < 0.001.

