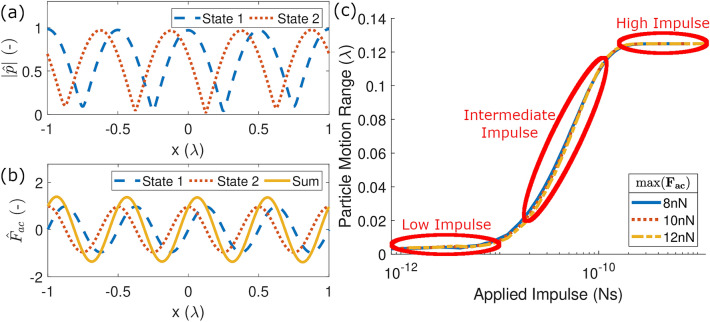
Figure 1.
(a) The two normalised absolute 1D pressure fields, , with one source’s phase output offset from the other by . (b) The normalised acoustic forces, , generated by the pressure fields in (a) and the sum of these two fields. (c) The variation in particle motion per cycle vs the applied impulse, , varied by both the maximum force and the switching time. The different lines indicate different maximum values which the force field was normalised to and each force was applied with a range from 0.1 ms up to 100 ms. Note that the lines overlap, indicating that applied impulse produces a consistent effect regardless of which component is altered.

