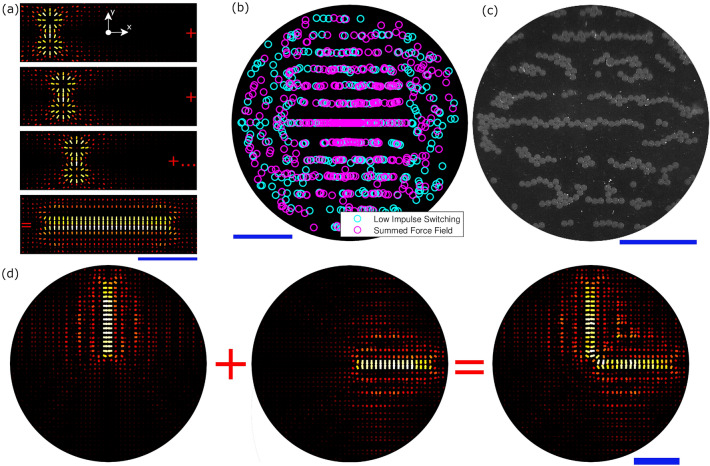
Figure 3.
(a) Force field summation in the low impulse regime. Each arrow scales both length and colour to the magnitude of the vector at the origin point. A 2 mm line is formed from 10 twin traps. The xy axis is the same as in Fig. 2a with the origin representing the centre of the array. (b) demonstrates a simulated comparison of the particle end locations after being exposed to the switched force field or the summed vector field shown in the bottom panel of (a). Both fields had a maximum force of 10 nN and in the switched case the ms. (c) shows the application of a low impulse switched field to real particles. (d) demonstrates the simulated combination of two of these lines to create an ‘L’ shape. Each side of the L-shape is 1.5 mm long and made up of 8 twin traps (16 total). The blue scale bars are 1 mm.

