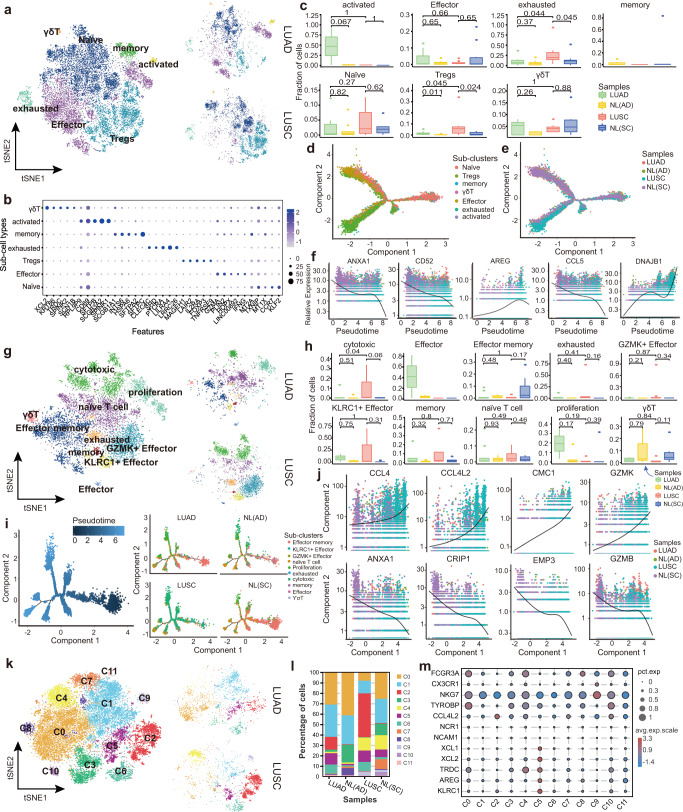
Fig. 4.
Re-clustering and developmental trajectory of T and NK cells in LUAD and LUSC. a Clustering of 15,853 CD4+ T cells from all samples. Each dot corresponds to a single cell, colored according to cell type. b Dot plot showing the expression of top 5 marker genes in each CD4 sub-cluster. The color and size indicate the effect size. c Percentages of each immune cell type in LUAD, LUSC, NL(SC), and NL(AD). Y-axis: Average percentages of samples across the four groups. Groups are shown in different colors. Each bar plot represents one subtype. Error bars represent ± SEM. All differences with P < 0.05 are indicated; Kruskal–Wallis rank test was used for analysis. d, e Developmental trajectory of CD4+ T cells inferred by monocle, colored by cell subtype and sample group. f Representative gene expression levels of different marker genes. The size of each dot represents relative expression levels. g Clustering of 8735 CD8+ T cells from all samples. Each dot corresponds to a single cell, colored according to cell type. h Percentages of each immune cell type in LUAD, LUSC, NL(SC), and NL(AD). Y-axis: Average percent of samples across the four groups. Groups are shown in different colors. Each bar plot represents one subtype. Error bars represent ± SEM. All differences with P < 0.05 are indicated; Kruskal–Wallis rank test was used for analysis. i Developmental trajectory of CD8+ T cells inferred by monocle, colored by pseudotime and cell subtype split by sample group. j Representative gene expression levels of different marker genes. The size of each dot represents the relative expression levels. k Clustering of 20,584 NK cells from all samples. Each dot corresponds to a single cell, colored according to cell type. l Average proportion of each NK subtype between LUAD, LUSC, NL(SC), and NL(AD). m Dot plot showing the expression of classic marker genes in each subtype

