Fig. 6.
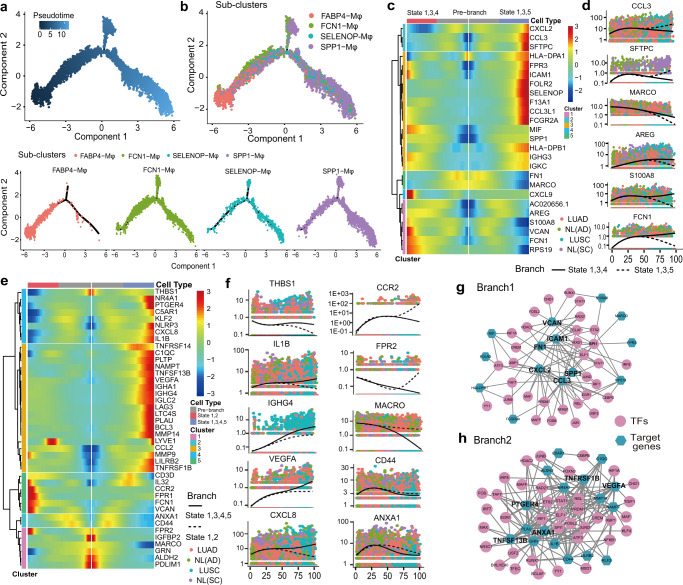
The trajectory analysis of Mφ in LUAD and LUSC revealed distinct features. a, b Differentiation trajectory of Mφ in all lung samples, with each point colored by pseudotime (a) and Mφ subtype (b) (bottom) which was divided into two branches. c, d Pseudo-heatmap showing the various genes in the differentiation process of Mφ in branch 1, which was clustered into five clusters, and a scatter distribution plot showing the expression variation of some specific genes in each state during the pseudotime. The fit curves representing the gene expression of two states, and color coded for cancer type. e, f Pseudo-heatmap showing the various genes involved in the differentiation process of Mφ in branch 2, which was clustered into five clusters, and the scatter distribution plot showed the expression variation of some specific genes in each state during the pseudotime. The fit curves represent the gene expression of two states, and color coded for cancer types. g, h Ligand–receptor connections network among TFs and their target genes in branch 1 (g) and branch 2 (h)

