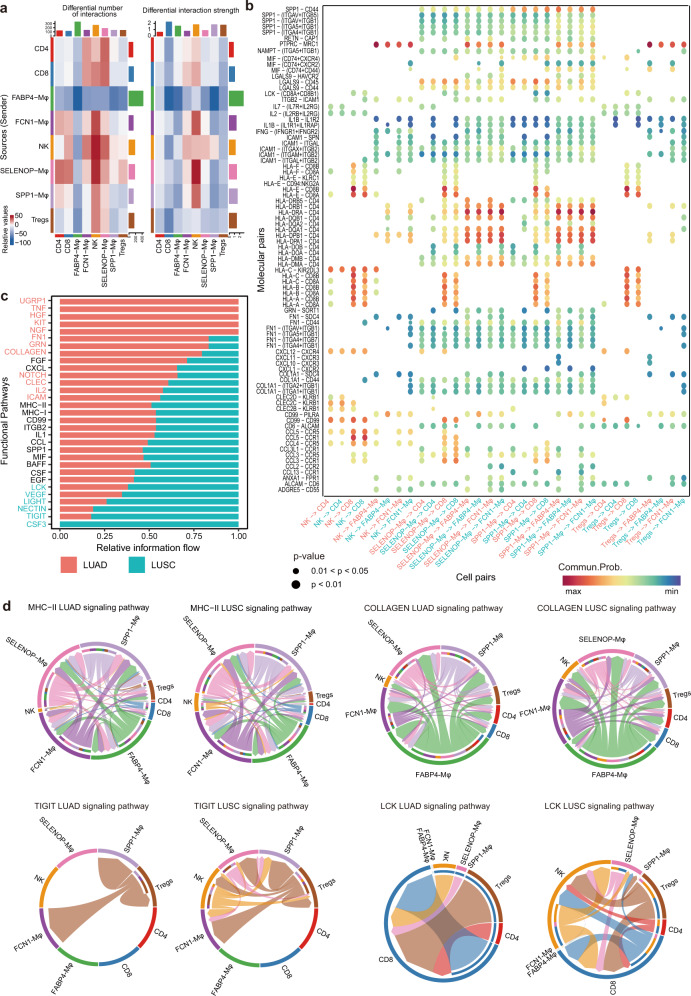
Fig. 7.
Differential communication patterns between Mφ subclusters and lymphocytes in LUAD and LUSC. a Heatmap showing the differential number and strength of interactions between Mφ subtypes and lymphocytes in LUAD and LUSC. The color represents the communication probability. b Selected significant ligand–receptor pairs that contribute to the signaling sending between cell types from LUAD and LUSC. The dot color and size represent the calculated communication probability and p values. The p values are computed from one-sided permutation test. c Selected significant signaling pathways were ranked based on their differences in overall information flow within the inferred networks between LUAD and LUSC. The top signaling pathways colored red are more enriched in LUAD, the middle ones colored black are equally enriched in LUAD and LUSC, and the bottom ones colored green are more enriched in LUSC. d Chord plot showing inferred intercellular communication network of MHC-II, Collagen, TIGIT and LCK signaling in LUAD and LUSC. Inner and outer bars showing autocrine and paracrine signaling to Mφ subtypes and lymphocytes, respectively. Bar sizes are proportional to the number of cells in each cell group and line width represents the communication probability

