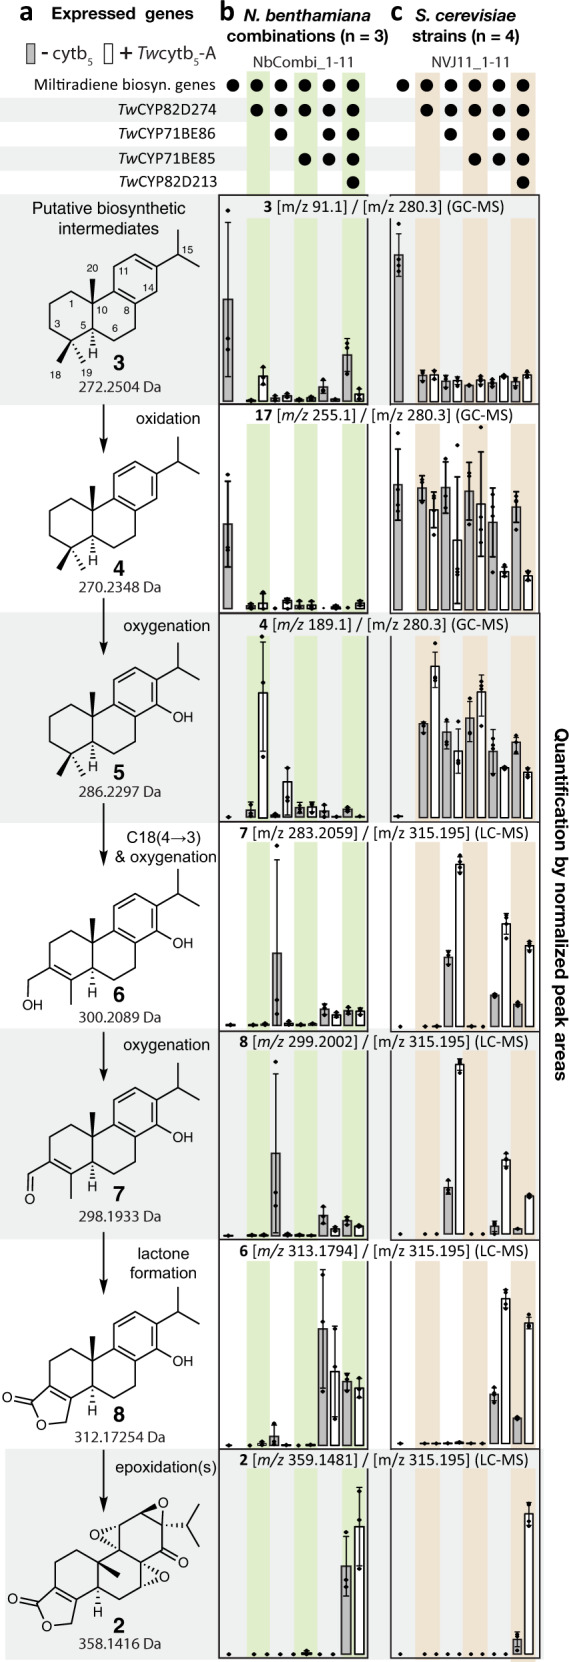
Fig. 2. Biosynthesis of triptonide from miltiradiene.

a Heterologously expressed genes constituting the minimal set of biosynthetic components required for heterologous triptonide biosynthesis. b quantity (bars) of putative key intermediates in the biosynthetic pathway of triptonide (right), when established in vivo via heterologous gene expression in N. benthamiana. c, quantification of intermediates from engineered S. cerevisiae (strains listed in Supplementary Table 28). The combination of genes co-expressed with the miltiradiene biosynthetic genes is indicated by black dots. Quantification was based on peak areas of signature m/z values for the putative intermediates, normalized to the peak area of signature m/z values for the internal standard (IS) used in the GC-MS (compounds 3–5) and LC-qTOF-MS (compounds 6–8 & 2). Signature m/z values are denoted in the header of each bar diagram. Bars represent the average of n = 3 [N. benthamiana] or n = 4 [S. cerevisiae] biological replicates, with error bars representing standard error of the mean (SEM). Values from each replicate is marked by black diamond squares. White- and grey fill color of the bars distinguishes compound quantity in relation to no expression (grey) or co-expression (white) of Twcytb5-A, respectively. Mass tolerance was ±0.1 m/z for GC-MS and ±0.005 m/z for LC-qTOF-MS for signature m/z values. Source data are provided as a Source Data file.
