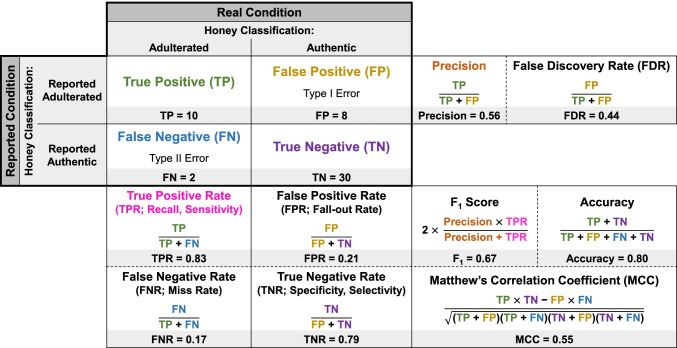
Fig. 2.
The confusion matrix and associated performance metrics. The core confusion matrix is within the bold outline; additional boxes provide formulas for calculating associated performance metrics. Dashed lines between metrics indicate interchangeable or tandem usage. Text color on certain classifications/metrics facilitates tracking use of those values in calculations and is not intended to highlight certain metrics as more important. A sample classification example is provided in the shaded gray cells for a test set of 50 honey samples (including 12 that are adulterated with non-honey sugar sources and 38 that are considered authentic, > 99.99% honey), where the classification model correctly reports 10 as adulterated and 30 as authentic but incorrectly reports 8 as adulterated and 2 as authentic

