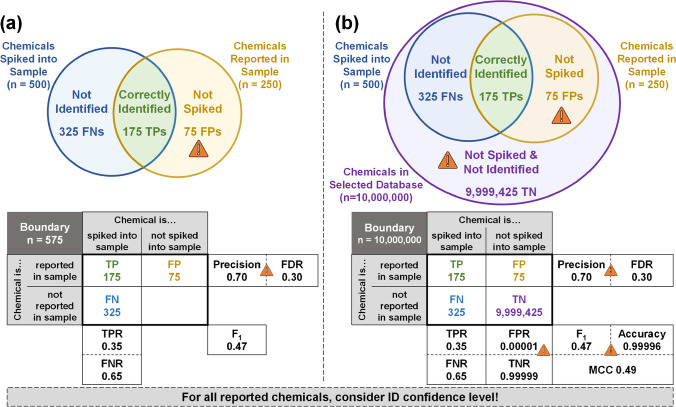
Fig. 3.
Venn diagram and confusion matrix representations of chemical identification performance assessment approaches, with a numeric example provided. Orange caution symbols indicate values where caveats should be carefully considered. (a) The approach considers only the chemicals spiked into the sample (blue circle) and reported in the sample (yellow circle), allowing calculation of metrics relying solely on TP, FP, and FN. (b) The approach from (a) is modified to include a database of interest (purple circle), allowing determination of TN and calculation of all performance metrics. Additional significant figures are listed for some metrics (i.e., FPR, TNR, Accuracy) to clearly provide exact values, given the number of TNs used in the calculation

