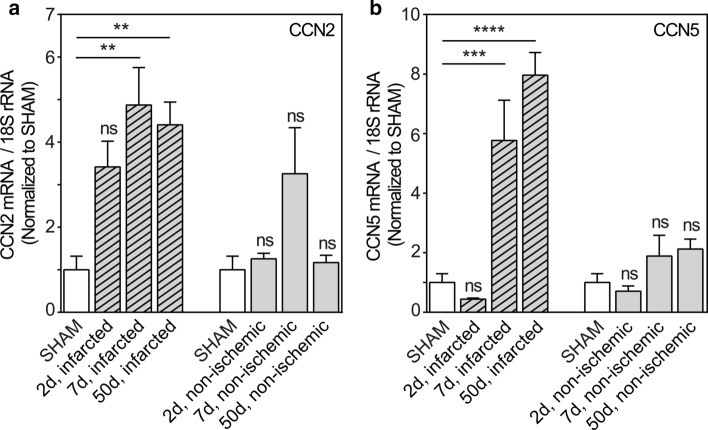
Fig. 1.
Time course of CCN2 and CCN5 mRNA levels in infarcted and non-ischemic myocardial tissue after induction of experimental myocardial infarction in mice. Histogram demonstrating CCN2 (panel a) and CCN5 (panel b) mRNA levels relative to 18S rRNA (house-keeping) in infarcted region and in non-ischemic myocardial tissue, harvested 2, 7, and 50 days after permanent ligation of the left coronary artery and normalized to levels in myocardial tissue of sham-operated mice. A column (open column) representing levels in myocardial tissue of sham-operated mice has been included both in front of columns showing levels in the infarcted region and in front of columns demonstrating levels in non-ischemic myocardial tissue. mRNA levels were analyzed by real-time RT-PCR. Data are shown as the mean ± SEM (n = 3 in each group). The data were subjected to statistical analyses by one-way ANOVA with Dunnett’s post hoc test. Statistically significant alterations were indicated by **p < 0.01; ***p < 0.001; ****p < 0.0001 versus sham-operated mice (SHAM); ns: indicates not statistically significant versus sham-operated mice (SHAM)

