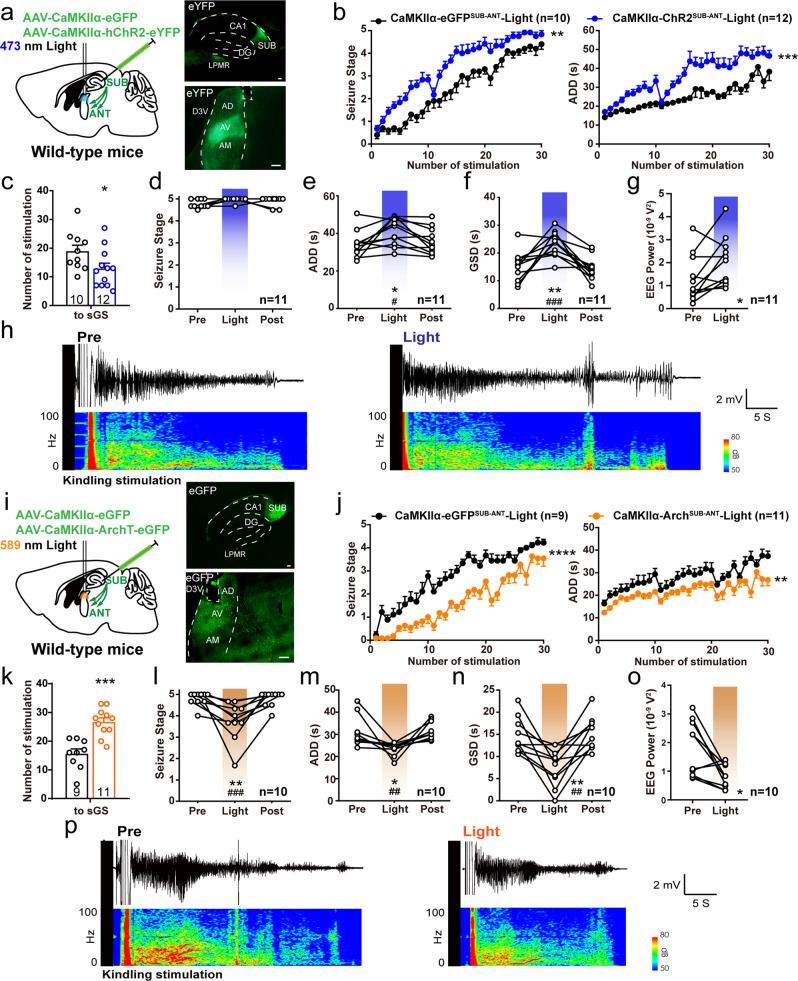
Fig. 2. SUB-ANT glutamatergic circuit bidirectionally mediates hippocampal seizures.
a Scheme of experiments and a representative sagittal image for ChR2-eYFP expression in the subiculum (SUB) and light stimulation in the anterior nucleus of thalamus (ANT). LPMR, lateral posterior thalamic nucleus, mediorostral part. AD, anterodorsal thalamic nucleus; AV, anteroventral thalamic nucleus; AM, anteromedial thalamic nucleus; D3V, dorsal 3rd ventricle. Scale bar, 100 μm. b Effects of optogenetic activation of SUB-ANT circuit on the development of seizure stage and after-discharge durations (ADD). Two-way repeated measures ANOVA, **P < 0.01, ***P < 0.001. c Number of stimulations needed to reach secondary generalized seizure (sGS). Unpaired t-test, *P < 0.05. Effects of optogenetic activation of SUB-ANT circuit on seizure stage (d), ADD (e), and GS durations (GSD, f) during sGS expression. Friedman with post hoc Dunn’s test for seizure stage. One-way repeated measures ANOVA with post hoc Dunnett’s test for ADD and GSD, *P < 0.05, **P < 0.01 compared to Pre, #P < 0.05, ###P < 0.001 compared to Post. g Spectral analysis of sGS EEG power (0–100 Hz) of the CA3. Paired t-test, *P < 0.05. h Representative CA3 EEGs and power spectrogram during sGSs. i Scheme of experiments and a representative sagittal image for Arch-eGFP expression in the subiculum and light stimulation in the ANT. Scale bar, 100 μm. j Effects of optogenetic inhibition of SUB-ANT circuit on the development of seizure stage and ADD. Two-way repeated measures ANOVA, **P < 0.01, ****P < 0.0001. k Number of stimulations needed to reach sGS. Unpaired t-test, ***P < 0.001. Effects of optogenetic inhibition of SUB-ANT circuit on seizure stage (l), ADD (m), and GSD (n) during sGS expression. Friedman with post hoc Dunn’s test for seizure stage. **P < 0.01 compared to Pre, ###P < 0.001 compared to Post. One-way repeated measures ANOVA with post hoc Dunnett’s test for ADD and GSD. *P < 0.05, **P < 0.01 compared to Pre, ## P < 0.01 compared to Post. o Spectral analysis of sGS EEG power (0–100 Hz) of the CA3. Paired t-test, *P < 0.05. p Representative CA3 EEGs and power spectrogram during sGSs. The number of mice used in each group is indicated in figure. Data are presented as means ± SEM.

