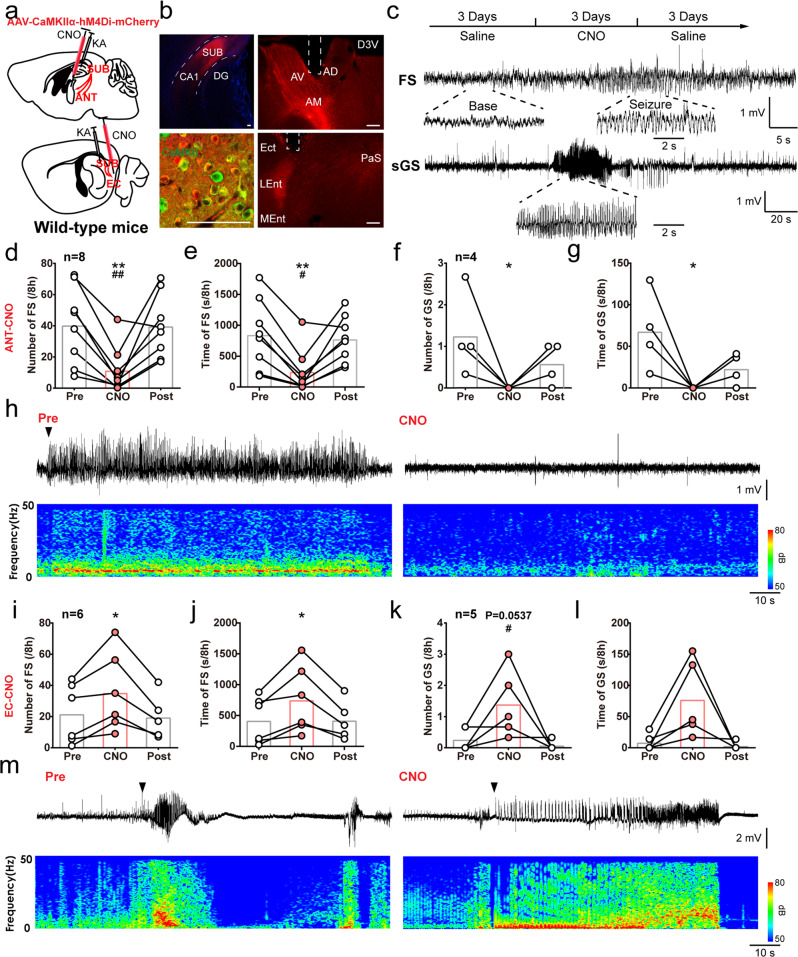
Fig. 4. SUB-ANT and SUB-EC circuits have opposite effects on hippocampal seizures in KA-induced chronic TLE model.
a Scheme of experiments for chemogenetic inhibition of Sub-ANT and Sub-EC circuits in KA-induced chronic model. KA was injected in the dCA1, AAV-CamkIIα-hM4Di-mCherry virus in the SUB, and CNO in the ANT or EC. b Left, representative coronal images show that mCherry florescence was expressed within the SUB (top) and highly co-expressed with CaMKII (bottom). Right, representative coronal images of the cannula placement in the ANT (top) or EC (bottom). Scale bar, 75 μm. c Top, scheme of experiments for CNO treatment in KA-induced chronic model. Bottom, typical EEGs of spontaneous focal seizure (FS) and secondary generalized seizure (sGS). Effects of chemogenetic inhibition of SUB-ANT circuit on the number and duration of FSs (d, e) and sGSs (f, g). One-way repeated measures ANOVA with post hoc Dunnett’s test for numbers and times of FSs, **P < 0.01 CNO compared with Pre, #P < 0.05, ##P < 0.01 CNO compared with Post. Friedman with post hoc Dunn’s test for numbers and times of sGSs, *P < 0.05 CNO compared with Pre. h Typical CA3 EEGs and power spectrum during one seizure in Pre-CNO and CNO injection in the ANT. The upper triangle indicates the seizure onset. Effects of chemogenetic inhibition of SUB-EC circuit on the number and duration of FSs (i, j) and sGSs (k, l). One-way repeated measures ANOVA with post hoc Dunnett’s test for numbers and times of FSs, *P < 0.05 CNO compared with Pre. Friedman with post hoc Dunn’s test for numbers and times of sGSs, P = 0.0537 CNO compared with Pre in numbers of sGSs, #P < 0.05 CNO compared with Post. m Typical CA3 EEGs and power spectrum of one seizure in Pre and CNO injection in the EC. The upper triangle indicates the seizure onset. The number of mice used in each group is indicated in the figure. Data are presented as means ± SEM.

