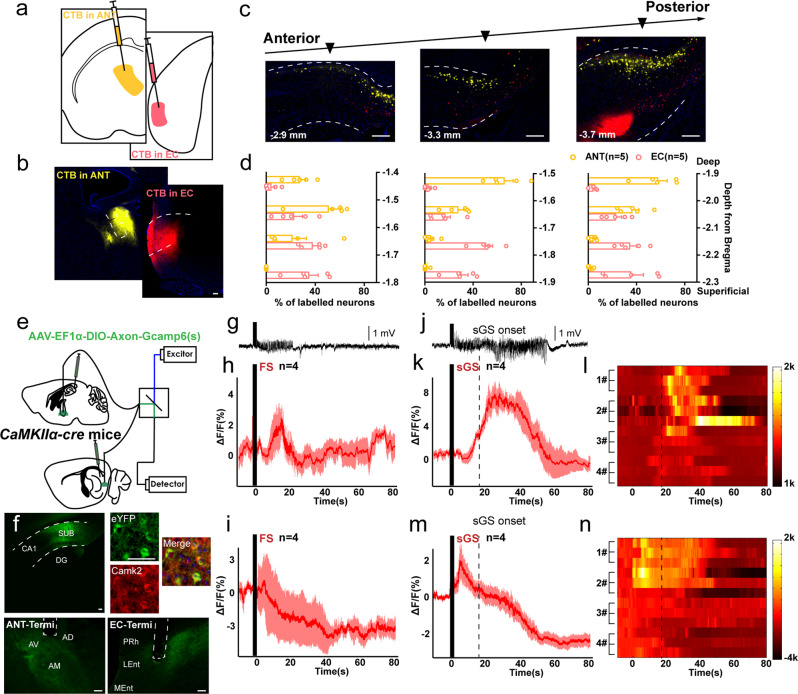
Fig. 5. The ANT-projecting and EC-projecting subicular neuron sub-populations have different responses to hippocampal seizures.
a Scheme of CTB injection in the anterior nucleus of thalamus (ANT) and entorhinal cortex (EC). b Representative images of CTB injection areas in the ANT and EC. Scale bar, 100 μm. c Representative images show somata locations of CTB-555 and CTB-647 in the subiculum (SUB) along the anterior-posterior axis. The number in the bottom indicated the approximate position to the bregma. Scale bar, 100 μm. d Quantification of CTB-555 and CTB-647 somata in the SUB, corresponding to bregma positions in (c). e Scheme of CaMKIIα-cre mouse injected with AAV-DIO-Ef1α-Axon-GCaMP6(s) and fiber photometry in the ANT and EC. f Left, representative coronal images of virus injection in the SUB and optical cannula placements in the ANT and EC in a CaMKIIα-cre mouse injected with AAV-DIO-Ef1α-Axon-GCaMP6(s). Right, the overlap between GCaMP6(s) and CaMKII+ neurons in the SUB. Scale bar, 25 μm for the upper right images and 100 μm for the rest. g Typical hippocampal EEG of a mouse with focal seizure (FS), corresponding to h and i, the black bar indicated kindling stimulation period, also applied to h–j, k, m. h, i Average calcium signals (shown in ΔF/F) in the ANT and EC during FSs. j Typical hippocampal EEG of a mouse with secondary generalized seizures (sGS), corresponding to k and m. k Average calcium signals (shown in ΔF/F) in the ANT during sGSs. 3 trials for each mouse. l Heatmaps corresponding to the average calcium signals in the ANT during sGSs. m Average calcium signals (shown in ΔF/F) in the EC during sGSs. 3 trials for each mouse. n Heatmaps corresponding to the average calcium signals in the EC during sGSs. The number of mice used in each group is indicated in the figure. Data are presented as means ± SEM.

