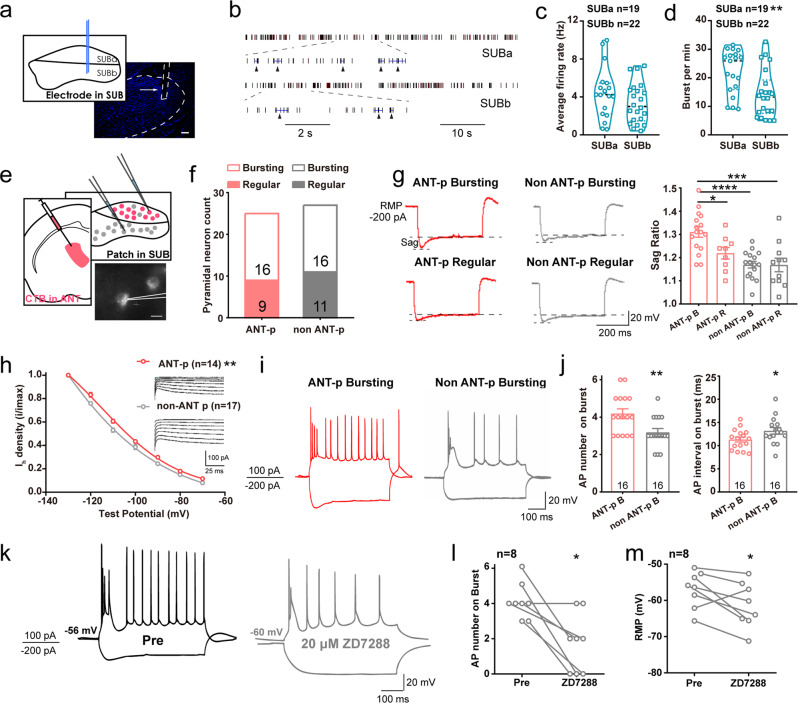
Fig. 6. ANT-projecting subicular neurons show stronger bursting intensity intrinsically facilitated by HCN channel.
a Scheme and representative image of in vivo recording in distinct layers of the subiculum (SUB). Scale bar, 100 μm. b Typical firing rate of bursting units in the SUBa and SUBb. Each subjacent triangle indicates a defined bursting. Graphs of average firing rate (c) and burst per minute (d) of bursting units in the SUBa and SUBb in the basal state. Unpaired t-test, **P < 0.01. e Scheme of in vitro electrophysiological patch in the somata of ANT-projecting and non-ANT-projecting subicular neurons and one representative ANT-projecting subicular neuron. Scale bar, 10 μm. f Statistics of number of ANT-projecting and non-ANT-projecting burst and regular firing neurons. g Left, representative voltage traces and current from patched neurons. Right, graph of the sag ratio between ANT-projecting and non-ANT-projecting bursting and regular firing neurons, n = 16, 9, 16, 11, respectively. One-way ANOVA with post hoc Tukey’s test, *P < 0.05, ***P < 0.001, ****P < 0.0001. h Ih voltage-dependent activation curves between ANT-projecting and non-ANT-projecting neurons. Both curves fitted with Boltzmann function. Two-way repeated measures ANOVA, **P < 0.01. i Representative action potentials of ANT-projecting and non-ANT-projecting subicular bursting neurons evoked by −200 and100 pA injection current. j Graphs of action potential number and frequency on burst between ANT-projecting and non-ANT-projecting subicular bursting neurons. Mann–Whitney test, *P < 0.05, **P < 0.01. k Representative action potentials in one subicular bursting neuron before and after incubation of 20 μM HCN channel blocker, ZD7288. Graph of action potential number on burst (l) and rest membrane potential (m) before and after ZD7288 buffering. Wilcoxon matched-pairs signed rank test for AP number on burst, *P < 0.05. Paired t test for RMP, *P < 0.05. The number of mice used in each group is indicated in the figure. Data are presented as means ± SEM.

