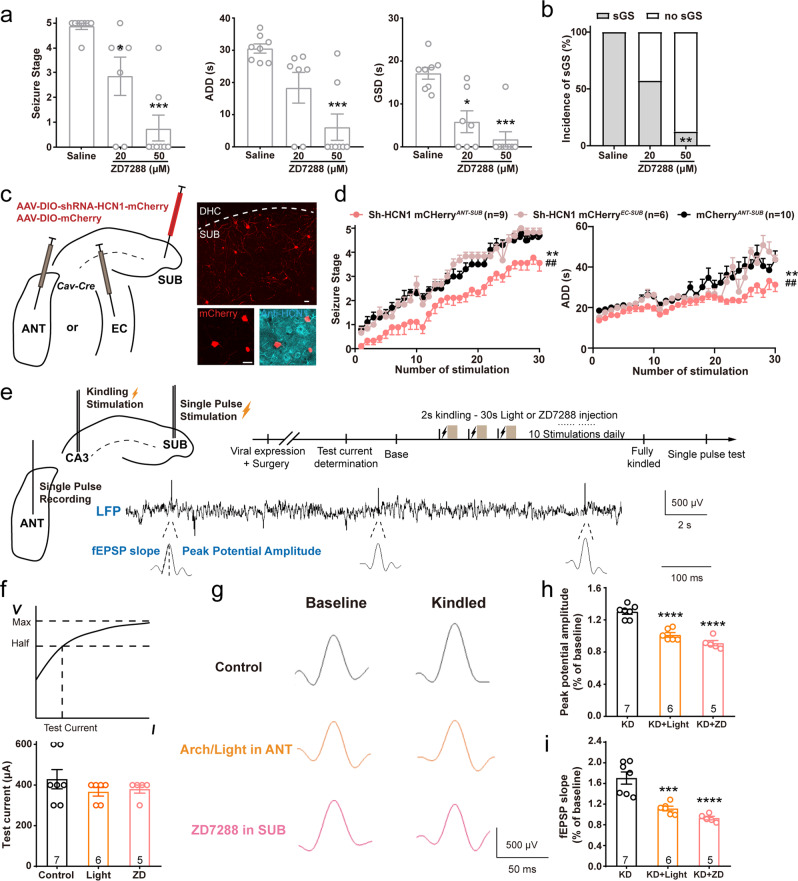
Fig. 7. HCN channel-based synaptic plasticity in the SUB-ANT circuit contributes to hippocampal seizures.
a Effects of ZD7288 (intra-subicular injection, 500 nL) on the seizure stage, after-discharges durations (ADD), and generalized seizure durations (GSD) of sGS expression. N = 8, 7, and 9 mice, respectively. Kruskal–Wallis with post hoc Dunn’s test, *P < 0.05, ***P < 0.001 compared with Saline. b Effects of ZD7288 on the incidence of sGS. N = 8, 7, and 9 mice, respectively. Fisher’s exact test, **P < 0.01. c Left, scheme of experiments for viral expression in the ANT, EC and subiculum for conditional knockdown of HCN expression in ANT- and EC-projecting subicular neurons of wild-type mice. Right top, representative coronal image of mCherry florescence in the subiculum from a Sh-HCN1-mCherry ANT-SUB mouse. Right bottom, mCherry co-labeled with anti-HCN1, indicating the efficacy of knockdown. Scale bar, 25 μm. d Effects of HCN1 knockdown in a specific circuit on the development of seizure stage and ADD in hippocampal kindling model. Two-way repeated measures ANOVA post hoc Scheffe’s test, **P < 0.01, ShRNA-HCN1ANT-SUB compared to mCherry; ##P < 0.01, ShRNA-HCN1ANT-SUB compared to ShRNA-HCN1EC-SUB. e Scheme of experiments for field excitatory postsynaptic potential (fEPSP) with single pulse test in the SUB-ANT circuit, and typical LFP recorded in the ANT during the test. f No differences were observed in test currents of the CaMKIIα-eGFP SUB-ANT-light (Control), CaMKIIα-Arch SUB-ANT-light (Arch), and CaMKIIα-eGFP SUB ZD7288 (50 μM, 500 nL, ZD) groups. g Representative images of the single pulse response in the ANT in baseline and kindled state of three groups. Graphs of peak spike amplitude (h) and fEPSP slope (i) change in base and kindled states of three groups. One-way ANOVA with post hoc Dunnett’s test, ***P < 0.001, ****P < 0.0001 compared with control group. The number of mice used in each group is indicated in the figure. Data are presented as means ± SEM.

