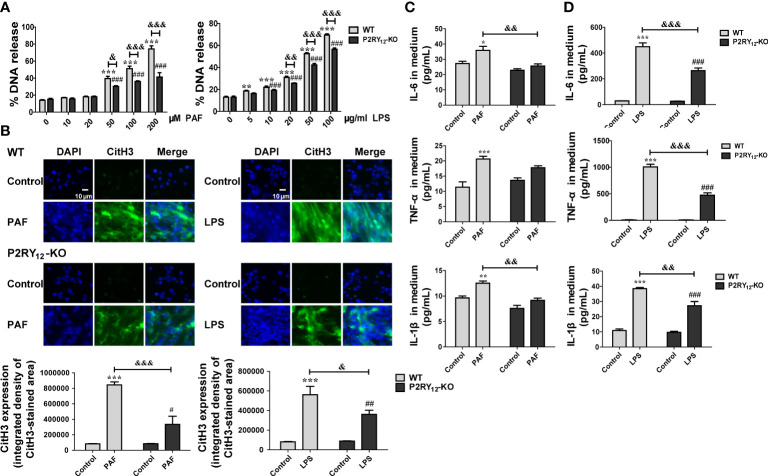
Figure 1.
Effects of P2RY12 on PAF and LPS-induced NET release and inflammatory responses. (A) Different concentrations of PAF or LPS induced the release of cfDNA from WT or P2RY12-KO neutrophils (n = 4). (B) Immunofluorescent staining and statistical analysis of CitH3 and DAPI staining of WT or P2RY12-KO neutrophils induced by PAF and LPS, respectively (n = 4). (C, D) Release of IL-6, IL-1β, and TNF-α in medium of WT or P2RY12-KO neutrophils induced by PAF and LPS, respectively (n = 4). All the data are shown as the mean ± SEM. *P < 0.05, **P < 0.01, ***P < 0.001 vs. WT control; ### P < 0.001 vs. P2RY12-KO Control; & P < 0.05, && P < 0.01, &&& P < 0.001, WT vs. P2RY12-KO. #P < 0.05, ##P < 0.01.

