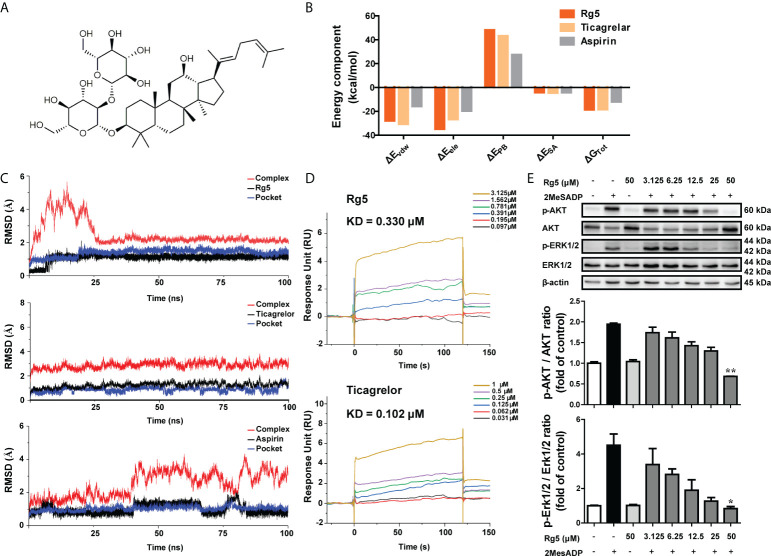
Figure 2.
Interaction between Rg5 and P2RY12. (A) Chemical structure for Rg5. (B) Comparison of binding free energy between Rg5, Ticagrelor, and Aspirin binding to P2RY12. ΔEvdw, van der Waals energy; ΔEele, electrostatic energy; ΔEPB, Poisson–Boltzmann energy; ΔESA, nonpolar energy; ΔGTot, total binding free energy. (C) Stability analysis of Rg5, Ticagrelor, and Aspirin binding to P2RY12. (D) SPR analyses of Rg5 and Ticagrelor binding to P2RY12. (E) Protein expression and phosphorylation levels of AKT (n = 3) and ERK (n = 3). All the data are shown as the mean ± SEM. *P < 0.05, **P < 0.01 vs. 2MesADP group.

