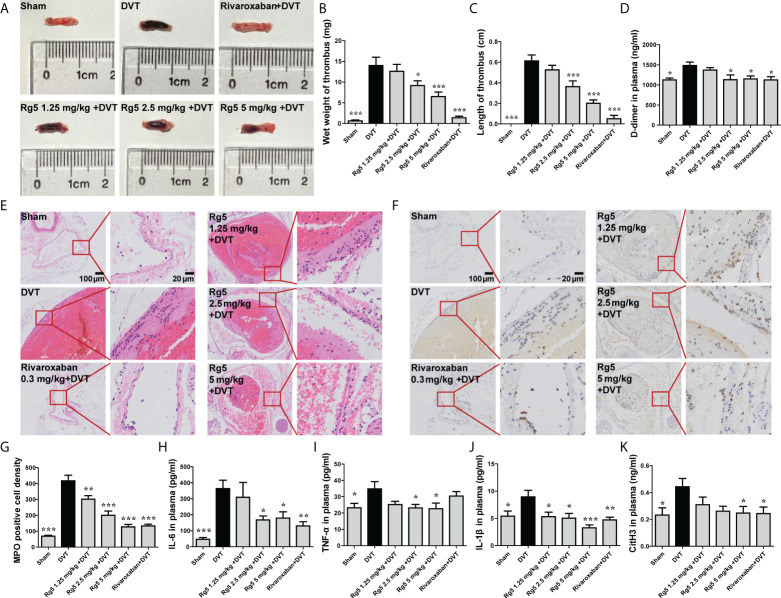
Figure 4.
Effect of Rg5 administration on thrombosis and inflammation in DVT mice. (A) Morphology of venous thrombosis. (B, C) Thrombus wet weight and length (n = 8). (D) Plasma D-dimer content (n = 7). (E) HE staining of inferior vena cava. (F) MPO immunohistochemical staining of inferior vena cava. (G) MPO positive cell density (n = 6). (H–K) Plasma contents of IL-6, IL-1β, TNF-α, and CitH3 (n = 7). Data are shown as the mean ± SEM. *P < 0.05, **P < 0.01, ***P < 0.001 vs. DVT group.

