FIGURE 2.
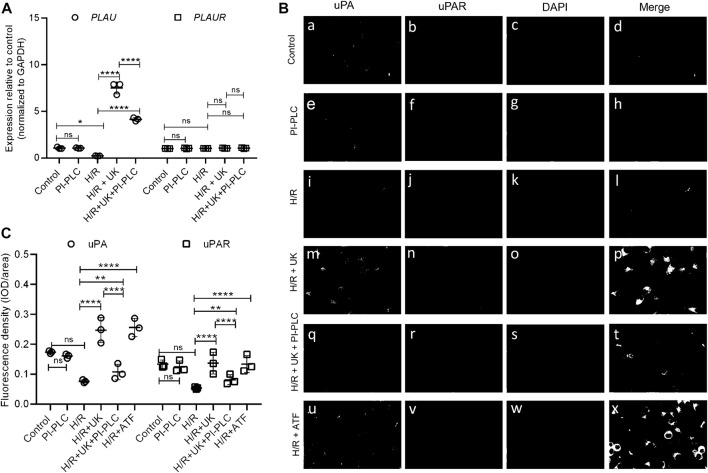
Exogenous uPA treatment induces uPAR protein expression without changes in its transcript expression. (A) Relative expression of PLAU (encoding uPA) and PLAUR (encoding uPAR) was determined in indicated conditions using RT-qPCR. Data are represented as mean ± SD; **p < 0.05, ****p < 0.0001, ns, not significant (n = 3). (B) Representative immunofluorescence images of uPA and uPAR expression in BEAS-2B cells, including control group (a–d) and cells subjected to PI-PLC (e–h), H/R (i–l), H/R + UK (m–p), and H/R + UK but pretreated with PI-PLC (q–t). Scale bar, 100 μm. (C) Relative expression of uPA and uPAR. The relative expression was based on the fluorescence intensity of IF and the signal was quantified using Image-Pro Plus (UK: urokinase).

