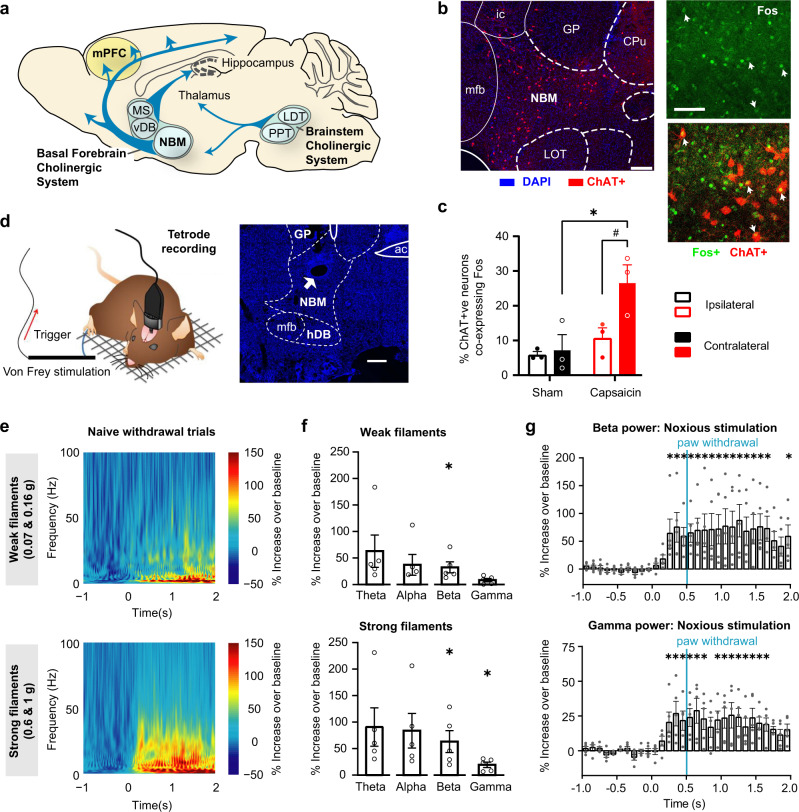
Fig. 1. Recruitment of the Nucleus Basalis of Meynert (NBM), a basal forebrain cholinergic nucleus, by noxious stimuli eliciting pain-like behavior.
a Schematic of the main cholinergic nuclei in mouse brain (b, c) Typical examples (a) and quantification (b) of capsaicin-induced increase in Fos immunohistochemistry in NBM cholinergic neurons (ChAT + ve; arrows: co-labeled cells). n = 3 mice/group; P < 0.05 (*0.0103, #0.0263), two-way ANOVA with Sidak’s multiple comparisons test. d Schematic representation (sourced from ref. 31) of in vivo tetrode recordings in the NBM (white arrow: electrode tip lesion in section) in response to von Frey mechanical stimulation of hindpaw. e Mean time–frequency representation of spectral modulation in the NBM for all trials with paw-withdrawal response to either weak filaments (0.07 g and 0.16 g;) or strong filaments (0.6 g and 1 g). f, g Corresponding quantification of power (f) of oscillatory activity in frequency ranges theta (4–8 Hz), alpha (8–14 Hz), beta (14–30 Hz) and gamma (30–100 Hz), represented as % change in 2 s post-application period over 1 s baseline activity prior to stimulus application, and corresponding time course (g); vertical blue line: time of paw withdrawal. In e, g, n = 5 mice; *P < 0.05; One-sample t test (two-tailed) was employed in f; t and P values for the different groups are as follows: Weak filaments: t = 2.06, 1.89, 3.10, 2.60; P = 0.108, 0.132, 0.036, 0.060; Strong filaments: t = 2.50, 2.57, 3.07, 3.81; P = 0.067, 0.062, 0.037, 0.019; for theta, alpha, beta & gamma, respectively. One-way repeated measures ANOVA with Dunnet’s multi-comparison versus pre-stimulation baseline was employed in g (*P = 0.0058, 0.0007, 0.0143, 0.0048, 0.0021, 0.0019, 0.0106, 0.0013, 0.0005, 0.0007, 0.0001, 0.0028, 0.0013, 0.0006, 0.0011, 0.0148 for beta, and 0.0091, 0.0002, 0.0045, 0.0012, 0.0001, 0.0022, 0.0036, 0.0016, 0.0005, 0.0012, 0.0451, 0.0015, 0.0124, 0.0197 for gamma power time bins, from left to right, respectively). Scale bars represent 0.5 mm and 50 µm (right) in b and 250 µm in d. MS medial septal nucleus, vDB diagonal band of Broca, LDT laterodorsal tegmental nucleus, PPT pedunculopontine tegmental nucleus, mPFC medial prefrontal cortex, ac anterior commissure, CPu caudate putamen, GP glopus pallidus, LOT nucleus of the lateral olfactory tract, mfb medial forebrain bundle, ic internal capsule, ERP event-related potential or perturbation. Data are presented as mean +/− standard error of the mean (SEM).

