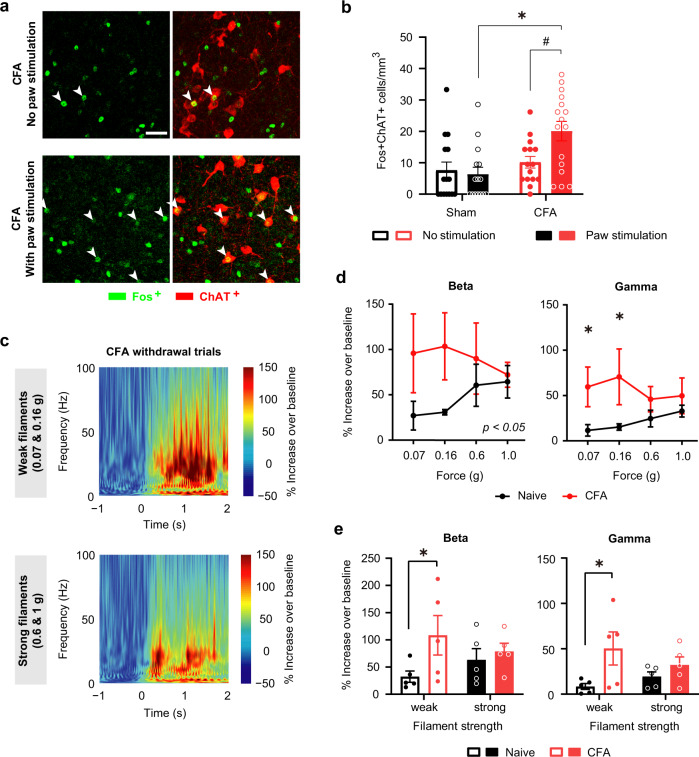
Fig. 2. Enhanced responsivity in cholinergic neurons and increased power of beta and gamma oscillatory activity in the NBM at peak of inflammatory pain-like behavior.
a, b Comparison of the activity of cholinergic neurons of the NBM in the presence or absence of application of mechanical stimulation with 0.16 g force to the contralateral plantar hindpaw under baseline conditions or 1 day after CFA injection. Shown are typical examples (a) and quantification (b); n = 4 mice/group; P < 0.05 (*0.0005, #0.0134), two-way ANOVA with Sidak’s multiple comparisons test. c Time–frequency representation of spectral power in the NBM in mice at day 1 after CFA injection (n = 5 mice/treatment). d, e Comparison of the power of oscillatory activity in beta and gamma frequency ranges between naive (sham) conditions and CFA day 1, calculated as % increase in 2 s post-application period over 1 s baseline activity prior to stimulus application. Shown are stimulus–response curves (d) or analysis of % change in spectral power (e) in response to innocuous filaments (0.07 and 0.16 g) and noxious mechanical pressure (0.6–1.0 g); n = 5 mice/group; *P < 0.05 (0.0417 for 0.07 g, 0.0244 for 0.16 g in d; 0.0425 for beta-weak & 0.0095 for gamma-weak in e), two-way ANOVA with Sidak’s multiple comparisons test. Data are presented as mean +/− SEM.

