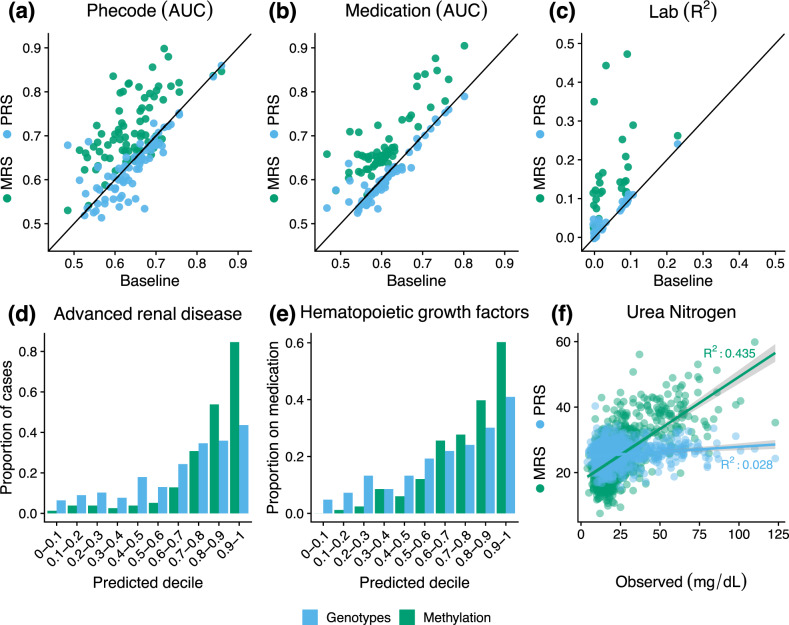
Fig. 1. MRS increases imputation accuracy on a variety of outcomes.
a–c The performance of the PRS (blue) and MRS (green) imputations on the y-axis with the baseline model performance on the x-axis. The performance of binary phenotypes (Phecodes (a), medications (b)) is measured using area under the ROC curve (AUC) and the performance of continuous phenotypes (lab results (c)) is measured using proportion of variance explained (R2). Shown is the performance on the union of outcomes that were significantly improved over the baseline model by either the MRS or PRS and that were significantly imputed by their corresponding predictor (72 Phecodes, 59 medications, and 31 labs). d–f The disease incidence as a function of the PRS (blue) and MRS (green) binned by deciles (d, e); and the observed Urea Nitrogen lab result value plotted against its imputed value (f).

