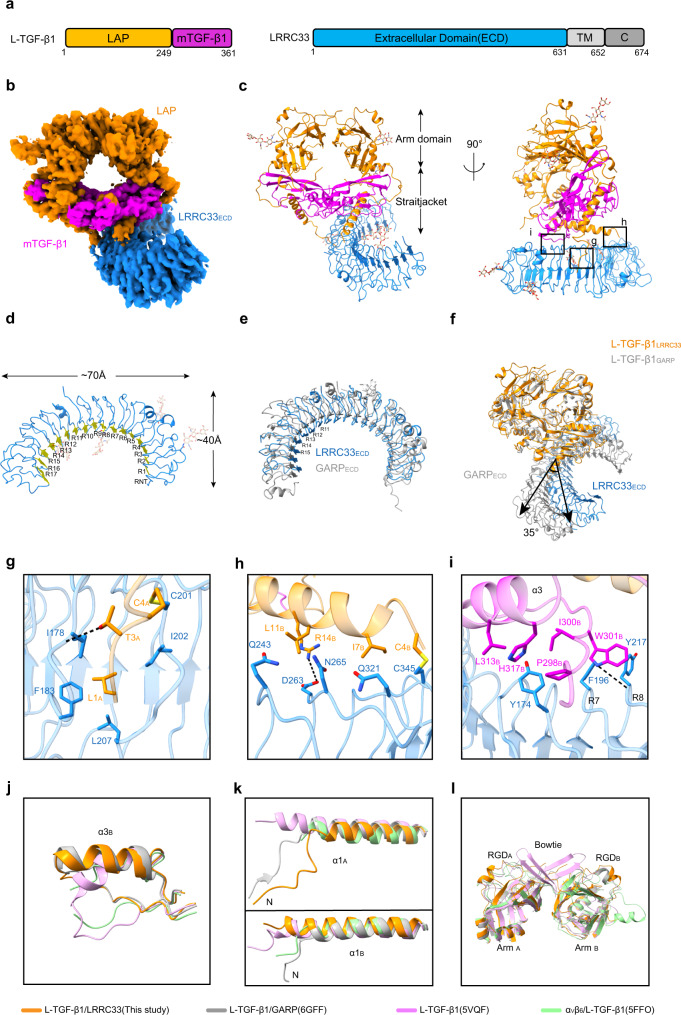
Fig. 1. Cryo-EM structure of the L-TGF-β1/LRRC33 complex.
a Sequence schematic diagrams of L-TGF-β1 and LRRC33. Chromatic bricks represent the protein regions used in our study, whereas gray bricks represent regions that are not included. Latency-associated peptide (LAP), mature TGF-β1 (mTGF-β1), and the extracellular domain of LRRC33 (LRRC33ECD) are colored in orange, magenta, and blue, respectively. b Cryo-EM map of the L-TGF-β1/LRRC33 complex. The contour level is 0.286. Individual domains are colored the same as those in a. c Overall structure of the L-TGF-β1/LRRC33 complex in ribbon presentation. The color code is the same as before. The Arm and straitjacket domains are labeled. d Ribbon diagram of LRRC33. R1 to R17, leucine-rich repeat (LRR); RNT, LRR N-terminal region. Yellow arrows represent the β strands in each repeat. e Superposition of individual LRRC33 and GARP (PDB code: 6GFF) from their complex structures with L-TGF-β1. LRRC33 is colored in blue, and GARP is colored in gray. R11-R15 of LRRC33 are indicated. f Superposition of L-TGF-β1/LRRC33 and L-TGF-β1/GARP (PDB code: 6GFF) complexes according to L-TGF-β1. Compared with GARP, LRRC33 rotates about 35 degrees relative to the diad axis of L-TGF-β1 dimer. g–i Interaction details between L-TGF-β1 and LRRC33 as indicated in the insets of c. Residues in different L-TGF-β1 monomers are distinguished by subscripts A and B. Black dashed lines represent hydrogen bond interaction (<4 Å). j–l Comparison of three distinguishing regions in L-TGF-β1 between our structure and others.

