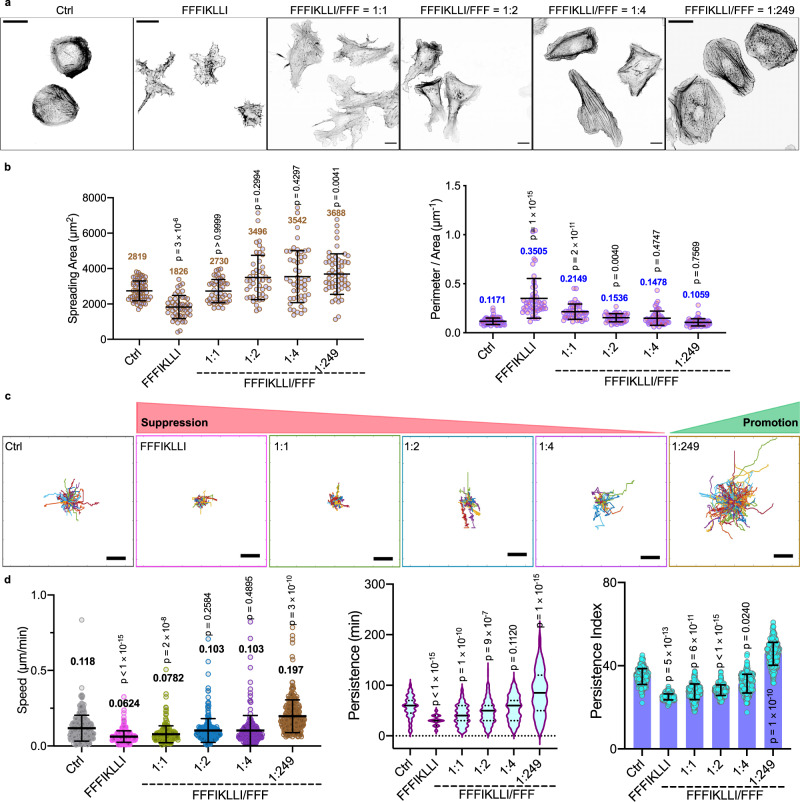
Fig. 2. Nanofilaments with various ligand presentations regulate both cell shape and cell migration.
a The phalloidin staining of Huh-7 cells with and without the treatment of various nanofilaments. Scale bars represent 20 μm. b The spreading area and the perimeter area ratio of HuH-7 cells under various conditions. Kruskal-Wallis with Dunn’s multiple comparisons test was used for analysis of the data. Data are presented as mean ± s.d. From left to right, n = 61, 49, 45, 46, 51, 56 cells, respectively. The trajectory plots c, and the correlated quantitative analysis of travel speed, persistence and persistence index d of randomly selected migrating cells for each incubation condition. Live cell images were taken every 10 min for a total of 10 h. Kruskal-Wallis with Dunn’s multiple comparisons test was applied in data analysis. Error bars represent standard error of mean. From left to right, n = 261, 280, 230, 260, 214, and 278 cells, respectively. Scale bars in panel c represent 50 μm. Source numerical data are available in source data.

