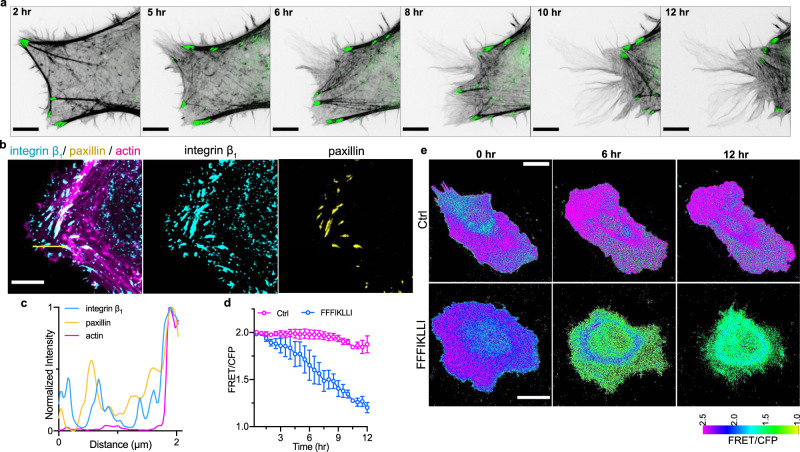
Fig. 4. Nanofilaments with super high ligand density induced uncoordinated FA dynamics preventing trailing edge retraction.
a Time-lapse series showing actin cytoskeleton (grey) and paxillin (green) in HuH-7 cells expressing mRuby-Lifeact-7 and mGFP-paxillin49 upon the treatment of FFFIKLLI (100 μM) for 12 hr. Scale bars represent 2 μm. Three independent experiments were performed. b F-actin phalloidin staining (magenta), integrin β1 (cyan) and paxillin (yellow) immunofluorescence in HuH-7 cell after 12 h treatment of FFFIKLLI (100 μM). Scale bar represents 2 μm. c Fluorescence intensity distribution profile of integrin β1, paxillin, and actin cytoskeleton along the yellow line on merged image of b. d 12 h time course Rac1 activity of HuH-7 cells with or without the treatment of FFFIKLLI (100 μM). Rac1 activity was measured by FRET. n = 6 cells (Ctrl) or 5 cells (FFFIKLLI). Symbols represent the mean FRET/CFP emission ratio ± s.d. e Representative FRET/CFP ratio images of HuH-7 cells expressing RaichuEV-Rac1 with or without the treatment of FFFIKLLI (100 μM) at the indicated time points and coded according to a pseudo-color scale, which ranges from yellow to purple with an increase in Rac1 activity. Scale bars represent 20 μm. Source numerical data are available in source data.

