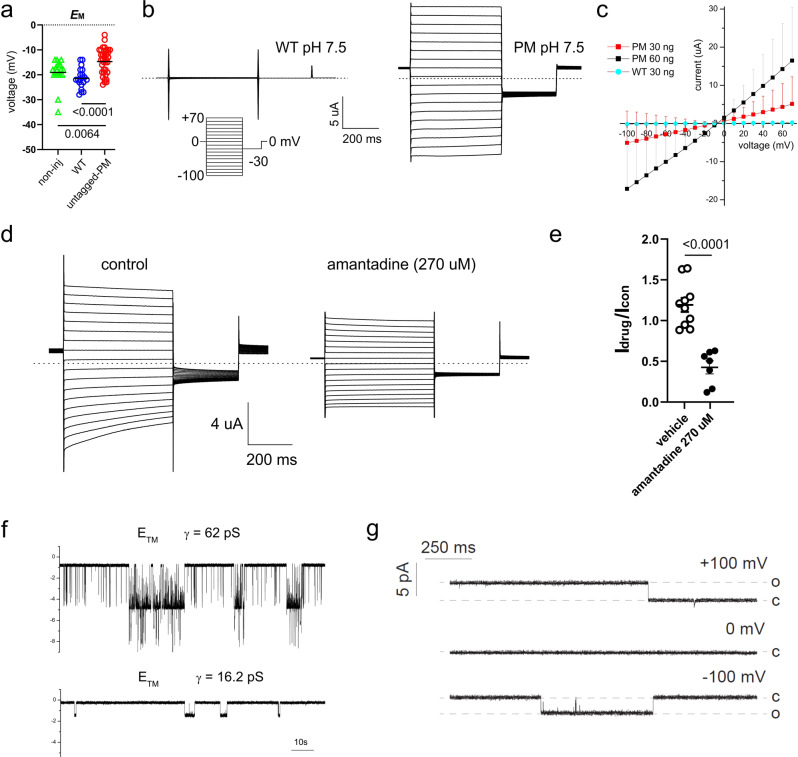
Fig. 1. SARS-CoV-2 E protein forms a cation channel in cells and artificial bilayers.
a Scatter plot of the resting (unclamped) membrane potential (EM) for Xenopus oocytes expressing untagged-PM (n = 35), WT (n = 20) or non-injected (non-inj) oocytes (triangles, n = 20) (statistical analysis by one-way ANOVA (P = 0.0002) and Tukey’s post hoc test, untagged-PM vs. WT, P < 0.0001; untagged-PM vs. non-inj, P = 0.0064; WT vs. non-inj, P = 0.3290). Data reproduced by permission from ref. 3. b Exemplar current traces for oocytes expressing WT (left panel) and untagged-PM (right panel) as indicated, at pH 7.5 (30 ng cRNA). Voltage protocol and scale bars are shown in the inset. Dashed lines indicate zero current level. Data reproduced by permission from ref. 3. c Large amplitude (µA) membrane currents on the expression of SARS-CoV-2 E protein are proportional to the quantity of RNA injected. Mean peak current versus voltage for oocytes after injection of 30 ng (red squares, n = 17) or 60 ng (black squares, n = 8) “untagged-PM” E protein cRNA, or after injection of 30 ng “WT” E protein cRNA (circles, n = 15). cRNA encoding WT and untagged-PM constructs was generated from cDNA in the pXOOM vector. Current data shown are mean ± SD, and are reproduced by permission from ref. 3. d Exemplar current traces for oocytes expressing untagged-PM E protein in the absence (control) or presence of amantadine (270 µM) at pH 7.5 (30 ng cRNA). Voltage protocol and scale bars are shown in the inset. Dashed lines indicate zero current level. Other experimental methods are described in ref. 3. e Scatter plot of fractional current at −80 mV remaining after incubation of oocytes expressing untagged-PM E protein in bath solution (vehicle) (n = 10) or amantadine (270 µM) (n = 7) as in (d). Statistical analysis performed by unpaired, two-tailed t test; bars indicate mean; error bars indicate SEM. f Single-channel currents recorded on reconstitution of a synthetic transmembrane (TM) fragment (amino acids 8–38) of E protein into artificial bilayers. The lipoprotein particles used to deliver the TM fragment into the lipid bilayer were prepared by using the protocol described in ref. 6 for the pentameric structure formation. Recordings were made in symmetrical 300 mM NaCl, 5 mM MgCl2, 10 mM HEPES, pH 7.2, and low-pass filtered at 50 Hz for display purposes. g Single-channel currents following the reconstitution of recombinant E protein into artificial bilayers using lipid nanodiscs5. E protein from cell-free protein expression in presence of lipid nanodiscs recorded in suspended lipid bilayer 4:1 DPhPC:DPhPS, in symmetrical 250 mM KCl, 10 mM HEPES, pH 7.4, 1 mM EGTA at +100 mV (upper trace), 0 mV (middle trace) and −100 mV (lower trace). Data were low-pass filtered at 500 Hz.

