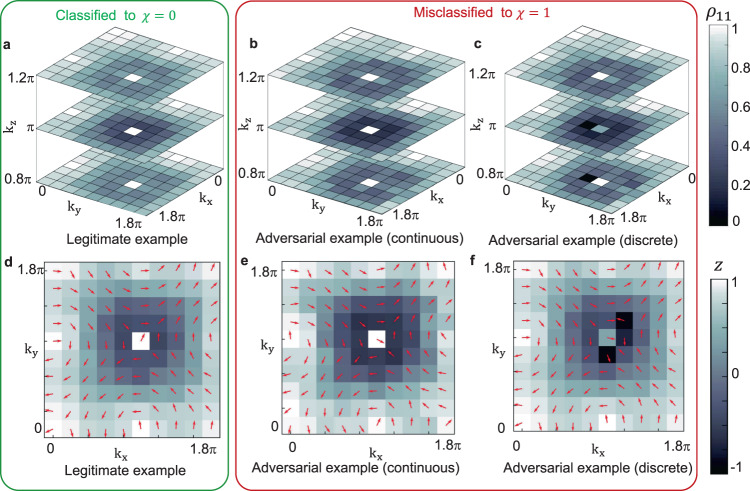
Fig. 3. Visualization of experimentally realized density matrices for the Hopf insulators with h = 3.2.
a–c The first component's magnitude of the input data for h = 3.2 at kz = 0.8π, π and 1.2π. a Legitimate sample with h = 3.2 implemented in the experiment. b Adversarial examples realized in the experiment with continuous perturbations generated by the projected gradient descent method. The average fidelity between the experimentally implemented adversarial examples and legitimate samples is over 98%. c Adversarial examples realized in the experiment with discrete perturbation generated by the differential evolution algorithm. Among 1000 density matrices as input, only seven of them have been changed and successfully mislead the classifier. d–f Measured spin texture for kz = π, h = 3.2. For each subfigure, kx and ky vary from 0 to 1.8π with equal spacing of 0.2π. At each momentum k, the state can be represented on the Bloch sphere. The arrows in the plane show the direction of the Bloch vector projected to the x − y plane. The colors label the z component of the Bloch vector. d Legitimate sample with h = 3.2 implemented in experiment. e Adversarial examples implemented in the experiment with continuous perturbations generated by the momentum iterative method. f Adversarial examples implemented in the experiment with discrete perturbation generated by the differential evolution algorithm.

