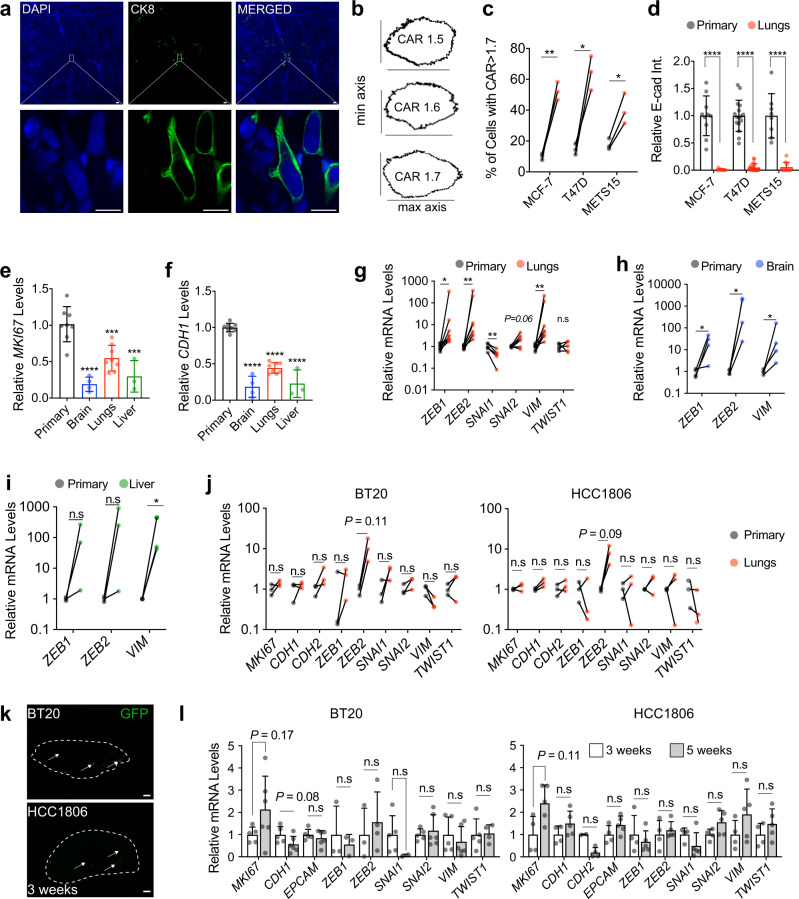
Fig. 3. Dormant DTCs from ER+ intraductal xenografts have an EMP signature.
a CK8 staining on optically-cleared sections of METS15 cells in host’s lungs. Scale bars, 10 µm. b Representative masks representing different cellular aspect-ratio (CAR) with respect to the morphology c Percentage of cells with CAR > 1.7 in matched primary tumors and in the lung from intraductal ER+ BC xenografts-bearing mice. Data represent mean ± SD, each data point represents at least 100 primary cells and 10 lung DTCs from 3 mice. Paired Student’s t-test. d Relative E-cad intensity (Int.) in matched primary tumor cells and lung DTCs in mice bearing indicated intraductal xenografts. Data represent n≥8 images, mean ± SD from 3 mice. Students t-test e, f Relative MKI67 (e) and CDH1 (f) mRNA levels in MCF-7 cells in the primary tumor (8 mice) or in the lung (n = 8), brain (n = 4), and liver (n = 3) DTCs. Data represent mean ± SD. One-way ANOVA. g–i Relative levels of indicated mRNAs in matched MCF-7 primary tumors and lung (g n = 8), brain (h n = 4), and liver (i n = 3) DTCs. Wilcoxon test. j Relative levels of indicated mRNAs in matched BT20 or HCC1806 primary tumors and lung metastases from 3 mice. Paired t-test. k Representative fluorescence stereo micrographs of lungs from at least 3 mice 3 weeks after intraductal injection of BT20 or HCC1806 cells. Arrows point to micro-metastases. Scale bar, 1 mm. l. Relative mRNA levels of the selected genes in 3 versus 5-6 weeks lung DTCs retrieved from at least 4 mice bearing BT20 (left) or HCC1806 (right), n ≥ 4. Data represent mean ± SD, Wilcoxon test. Gene expression was normalized to the geometric mean of GAPDH and HPRT in panels e–j, and l. *, **, ***, ****, and n.s. represent P < 0.05, 0.01, 0.001, 0.0001, and not significant, respectively.

