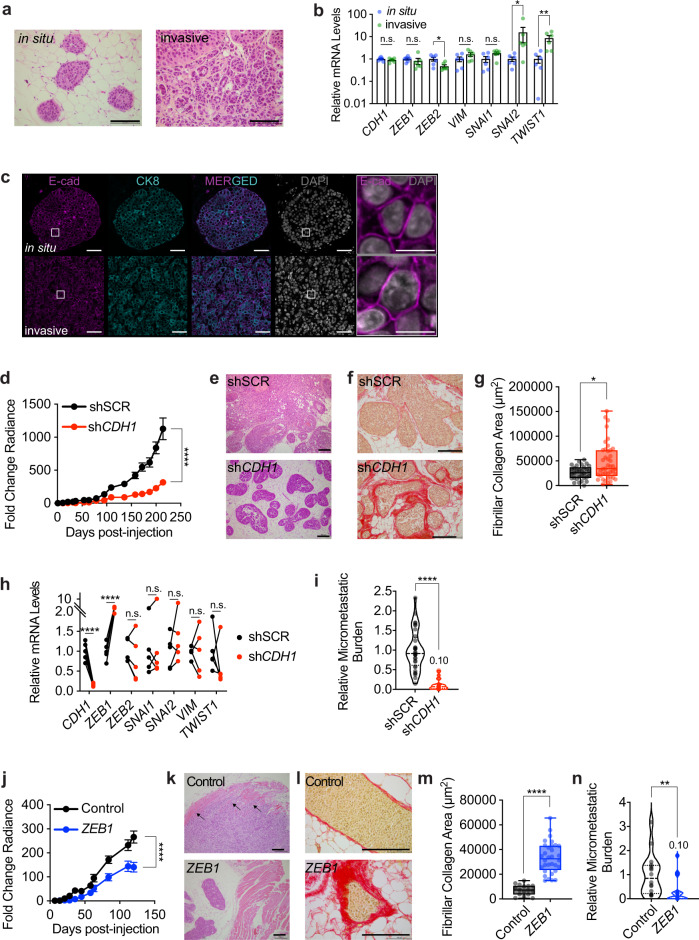
Fig. 4. Role of EMP in ER+ tumor progression.
a Representative H&E micrographs of in situ and invasive MCF-7 intraductal xenografts, scale bars, 100 µm. b Relative mRNA levels of marker genes in in situ and invasive MCF-7 intraductal xenografts. Data represent mean ± SD from 6 glands in 3 mice, non-parametric Mann-Whitney test. c Representative E-cad IF micrographs in in situ and invasive MCF-7 intraductal xenografts, scale bars, 50 µm; inlet, 10 µm. d Fold-change radiance of MCF-7 shSCR and shCDH1 in intraductal xenografts, mean ± SEM, n = 19 or 20 xenografts from 5 mice/condition. Two-way ANOVA, multiple comparisons. e, f Representative micrographs of H&E (e) and sirius red (f) stained MCF-7.shSCR and shCDH1 xenografts from ≥3 mice. Scale bars, 200 µm. g Box plot showing the area of collagen deposition from n ≥ 31 ducts, ≥3 mice. Boxes span the 25th to 75th percentile, whiskers 1.5 times the interquartile range. Boxplot whiskers show minimum and maximum values. h Relative mRNA levels of n = 5 contralateral MCF-7:shSCR and shCDH1 xenografts, 5 mice. Paired t-test. i Relative micro-metastatic burden in 7 MCF-7 shSCR and 8 MCF-7 shCDH1 tumor-bearing mice. Each dot represents a single organ, the dashed line indicates the median and dotted lines indicate the lower and upper quartiles. Unpaired Student’s t-test. j Fold-change radiance of control and MCF-7:ZEB1 xenografts, data represent mean ± SEM, n = 16 glands, 4 mice each. Two-way ANOVA, multiple comparisons. k, l Representative micrographs of H&E (k) and sirius red (l) stained thoracic mammary glands bearing control or MCF-7:ZEB1 cells, 3 mice each. Arrows indicate muscle invasion in thoracic mammary glands. Scale bars, 200 µm. m Box plot showing area of collagen deposition, n ≥ 17 ducts, ≥3 mice. Boxes span the 25th to 75th percentile, whiskers 1.5 times the interquartile range. Boxplot whiskers show minimum and maximum values. n Violin plot of the relative micro-metastatic burden from control and MCF-7:ZEB1 intraductal xenografts-bearing mice. Dashed line indicates the median, dotted lines indicate the lower and upper quartiles. Unpaired Student’s t-test. All mRNA expression levels were normalized to the geometric mean of GAPDH and TBP. *, **, ***, ****, and n.s. represent P < 0.05, 0.01, 0.001, 0.0001, and not significant, respectively.

