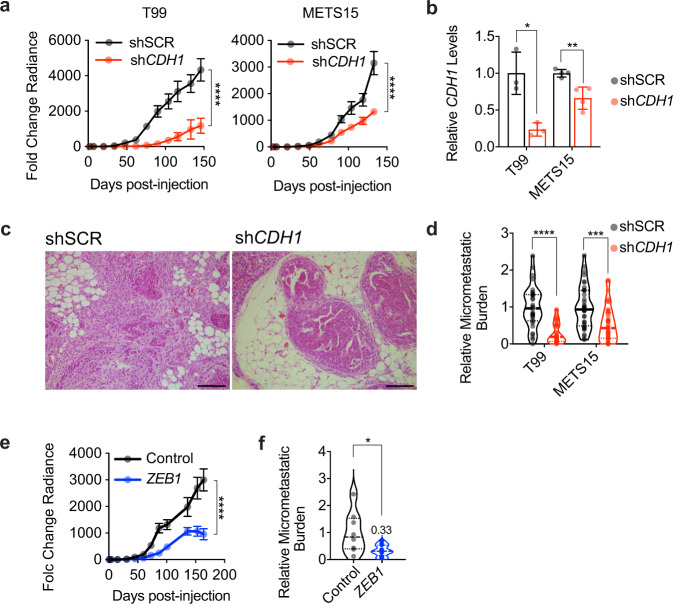
Fig. 5. Role of EMP in ER+ PDX progression.
a Growth curve of intraductal T99 and METS15 shSCR or shCDH1. Data represent mean ± SEM of 16 xenograft glands for each shSCR and shCDH1 groups for T99 and 16 and 20 xenograft glands, respectively, for METS15, 5 mice for each cohort. Two-way ANOVA, multiple comparisons. b Relative CDH1 expression in shSCR and shCDH1 intraductal xenografts (3 each for T99 and 4 each for METS15). Data represent mean ± SD. Unpaired Student’s t-test. c Representative H&E micrographs of T99 shSCR and shCDH1 xenograft glands. Scale bar, 200 µm. d Violin plot of the relative micro-metastatic burden in T99 and METS15 intraductal xenografts-bearing mice. The dashed line indicates the median and dotted lines indicate the lower and upper quartiles. Each dot represents a single organ. Unpaired Student’s t-test. e Growth curve of vector control and ZEB1-overexpressing T99 intraductal xenografts. Data represent mean ± SEM of 15 and 18 xenograft glands, respectively. Two-way ANOVA, multiple comparisons. f Violin plot of the relative micro-metastatic burden in lungs and bones from 4 control and 5 ZEB1-overexpressing T99 xenografts-bearing mice. The dashed line indicates the median and dotted lines indicate the lower and upper quartiles. Unpaired Student’s t-test. *, **, ***, ****, and n.s represent P < 0.05, 0.01, 0.001, 0.0001, and not significant, respectively.

