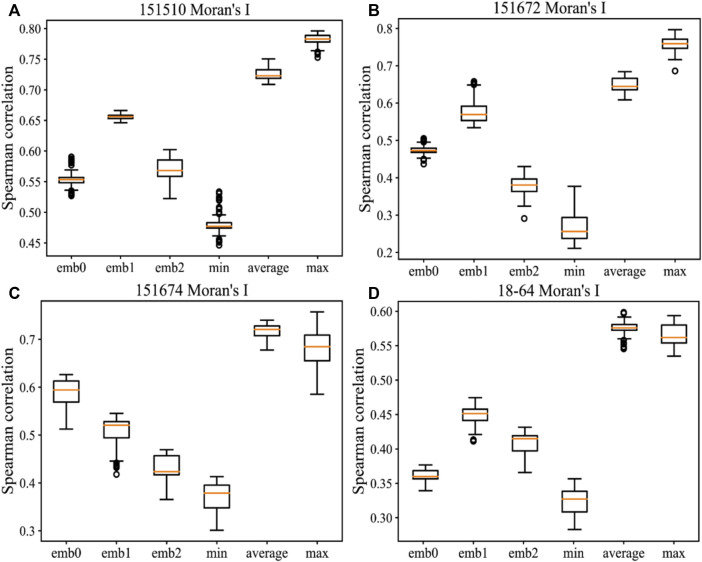
FIGURE 5.
Comparison of different methods for measuring Moran’s I on the following samples: (A) 151510, (B) 151672, (C) 151674, and (D) 18–64. The horizontal axis shows the methods of directly measuring Moran’s I on the first dimension (emb0), second dimension (emb1), and third dimension (emb2) in each embedding and the methods of combining Moran’s I with the minimum, average, and maximum filtering in all dimensions. The vertical axis shows the Spearman correlation measured by the ground-truth ranking and the ranking by MP-MIM. Each box shows all results in message passing with k_num values from 10 to 90 and l_num values from 1 to 15.

