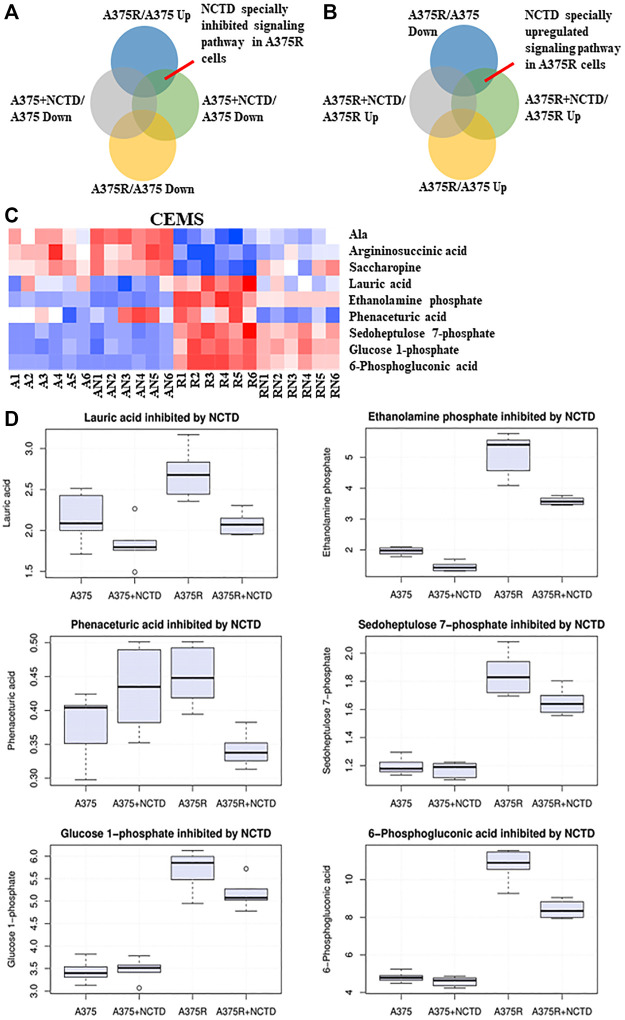
FIGURE 3.
NCTD inhibited Vem-induced upregulation of PPP based on CE-MS metabolomics analysis. (A,B) Intersection of many sets of metabolites revealed, especially downregulating and upregulating metabolites of NCTD in A375R cells. (C) Heatmap of significantly changed metabolites based on CE-MS in the A375, A375R, A375 + NCTD, and A375R + NCTD samples. Red in the heatmap represented the upregulated metabolites, and blue represented downregulated metabolites. (D) Six histograms showed statistically significantly downregulated metabolites in A375R cells.

