FIGURE 6.
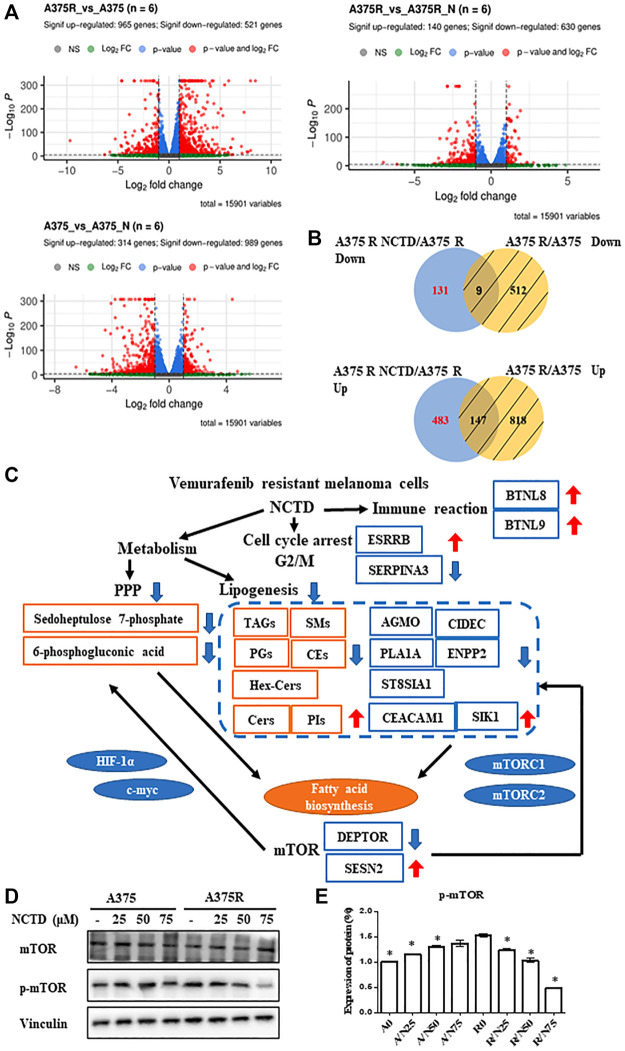
Integrated transcriptomics and lipidomics network analysis. (A) Volcano plot of differentially expressed genes in A375R versus A375, A375 versus A375 + NCTD, and A375R versus A375 + NCTD groups. (B) Intersection of many sets of genes revealed, especially inhibiting and upregulating genes of NCTD in A375R cells. (C) Differential correlation of metabolites, lipids, and genes. (D) A375 and A375R cells after being treated with various concentrations of NCTD for 12 h, and mTOR and p-mTOR were detected by Western blot. (E) Expression of the protein in Western blotting was evaluated as a fold of vinculin. Data were shown as mean ± SD from three independent experiments.

