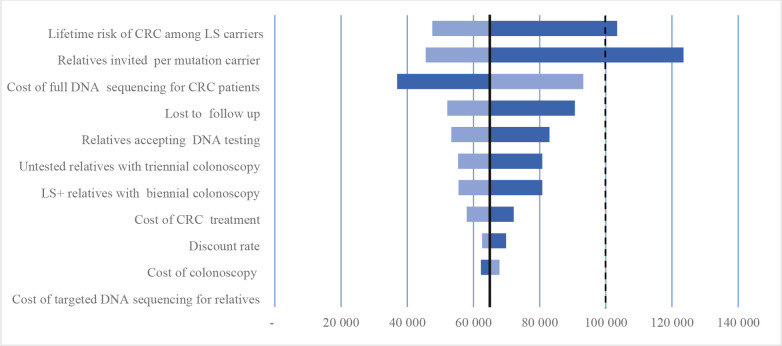
Figure 3.
Tornado diagram. One-way sensitivity analysis for universal DNA sequencing (Strategy 2). The Y axis shows tested parameters and the X axis shows cost per QALY saved. The change in cost-effectiveness associated with 50% decrease in each parameter is depicted by the darker bars, which indicate higher cost per QALY saved (ie, less cost-effective), the change associated with 50% increase in each parameter is depicted by the lighter bars, which indicate lower cost per QALY saved (ie, more cost-effective). The solid vertical line represents the default cost-effectiveness ratio of CHF 65 058 per QALY saved. The dotted vertical lines indicate cost-effectiveness threshold of CHF 100 000 in Switzerland. CRC, colorectal cancer; LS, Lynch syndrome; QALY, quality-adjusted life years.

