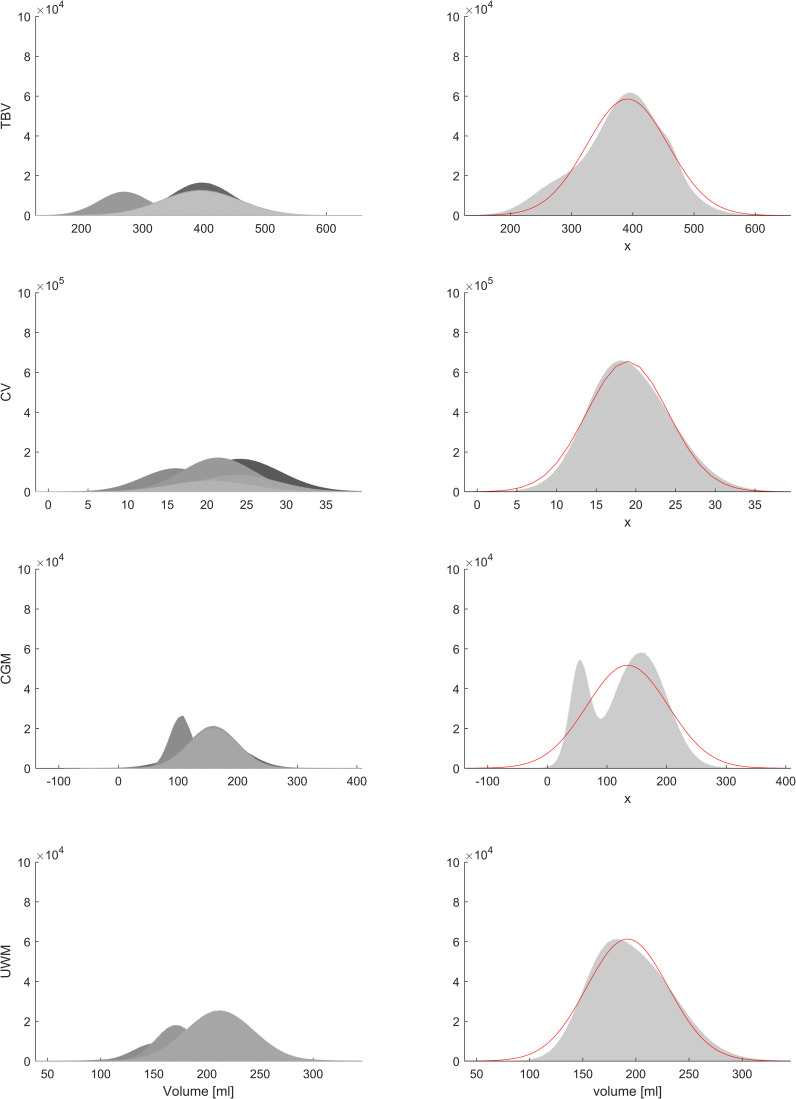
Figure 3.
Meta-analysis by simulation studies. CV, cerebellar volume; CGM, cortical grey matter volume; TBV, total brain volume; UMWM, unmyelinated white matter volume. Panels in the left column depict individual synthetic populations (according to simulations described in the Methods section), right column depicts summarising histograms and fitted Gaussian distributions. Resulting means, SDs and R2s are reported in table 2. Figure with permission and created by MW.

