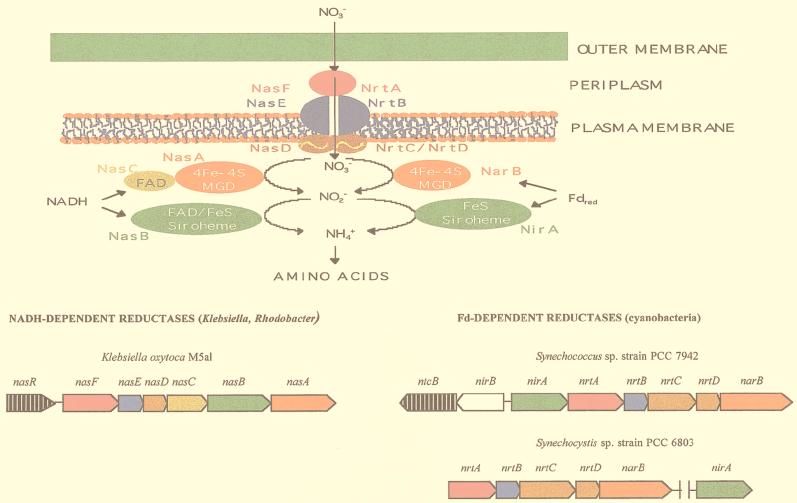
FIG. 2.
Nitrate assimilation and comparison of the organization of the nitrate assimilation gene clusters in bacteria. The scheme shows the cyanobacterial ferredoxin (Fd)-dependent assimilatory nitrate and nitrite reductases (right) and the NADH-dependent nitrate and nitrite reductases from Klebsiella and Rhodobacter (left). The organization of the Synechococcus, Synechocystis, and K. oxytoca (pneumoniae) nitrate assimilation gene clusters is shown beneath the corresponding proteins. Genes are drawn approximately to scale, and arrows show the direction of transcription. The genes and their products are shown in the same color. Regulatory genes are indicated by black arrows with white vertical lines. The product of the white gene is not shown.

