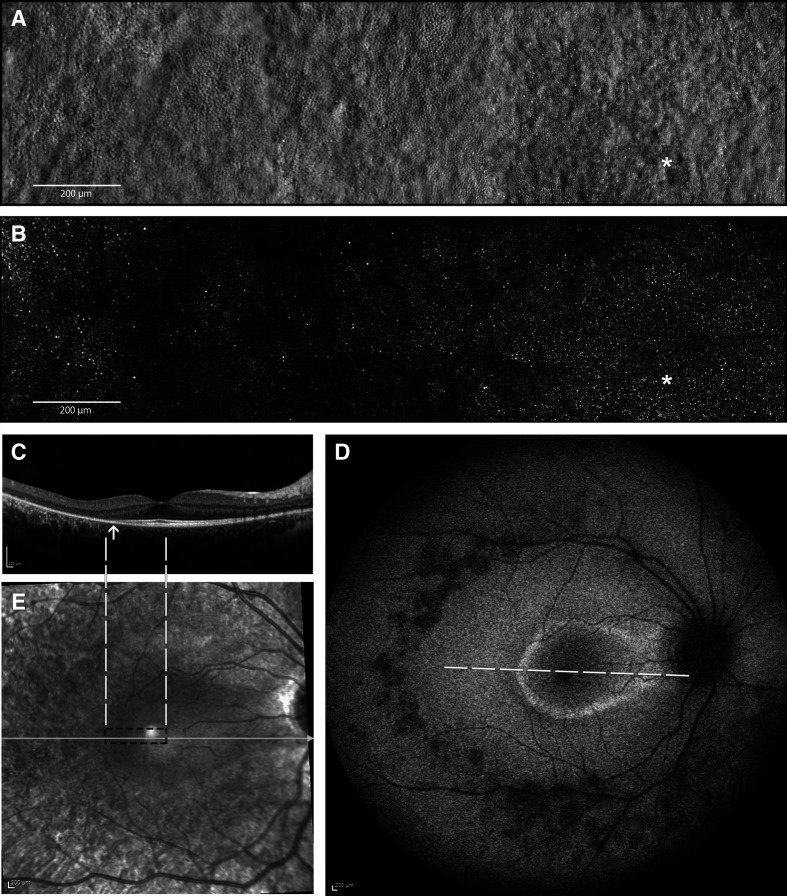
Figure 3.
Multimodal imaging of the right eye of the affected index patient (IV-3) at the age of 14 years. (A) Split-detection AOSLO from the fovea (white asterisk) out to 5° temporally capturing the en face cone photoreceptor inner segments; (B) confocal AOSLO from the fovea (white asterisk) out to 5° temporally capturing the en face cone photoreceptor outer segments; (C) horizontal transfoveal OCT line scan shows loss of inner segment ellipsoid band and outer retinal loss (indicated by arrow). Dashed white lines indicate the location and extent of the AOSLO en face images; (D) fundus autofluorescence image centred on the fovea 55° wide. A ring of parafoveal hyper-autofluorescence, patchy perifoveal hypo-autofluorescence, scattered areas of hypo-autofluorescence along the temporal arcades and in mid-peripheral retina. White dashed line indicates the location and extent of the OCT scan in C; (E) corresponding near infrared reflectance image of the OCT scan (white line) in C. Black dashed rectangle indicates the location and extent of the AOSLO en face images in A and B. AOSLO, adaptive optics scanning light ophthalmoscope; OCT, optical coherence tomography.

