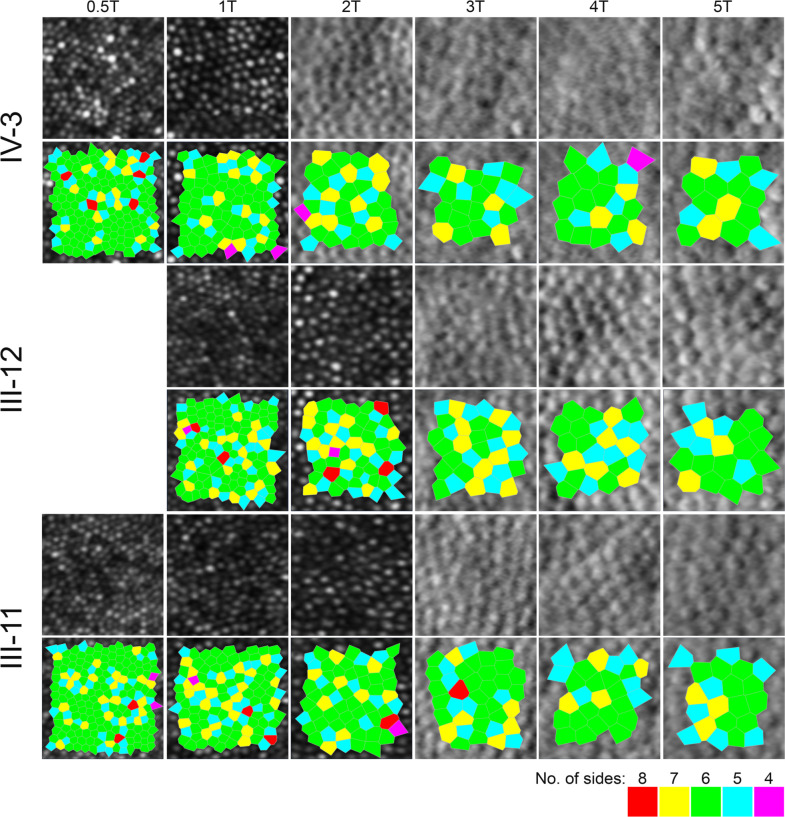
Figure 4.
Confocal (outer segments) and split-detection (inner segments) adaptive optics scanning light ophthalmoscope images in the index patient (top row) and her parents (middle and bottom rows) across their temporal meridian. Each crop is 55 microns square. Below each row, the bound cells that were used to derive the cone densities as shown in online supplemental file 7, are illustrated by the Voronoi tessellation.

