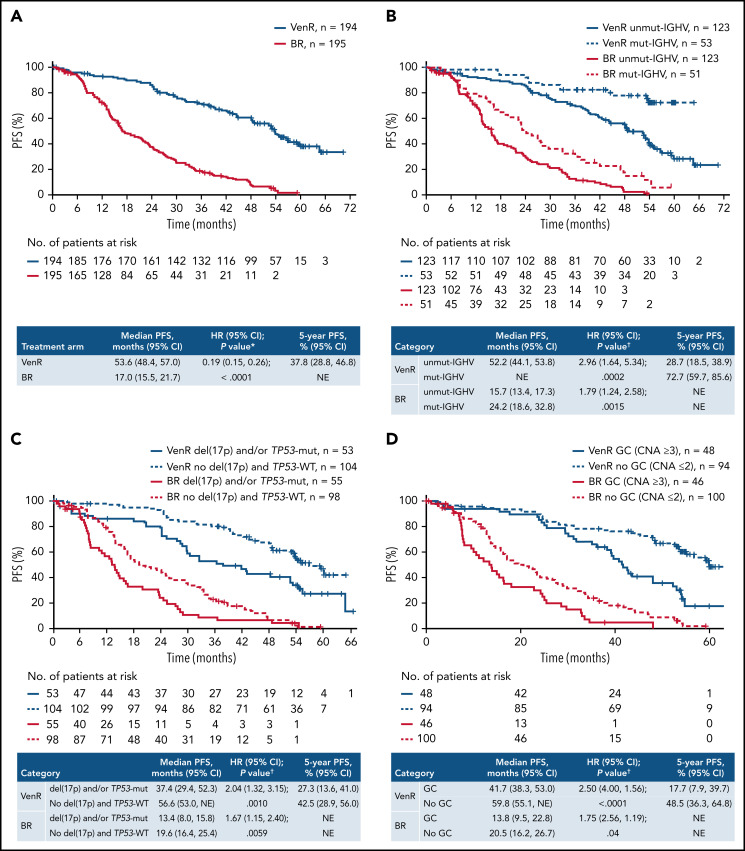
Figure 1.
Kaplan-Meier estimates of investigator-assessed PFS in the overall intention-to-treat population (A) and according to IGHV mutation status (B), del(17p) and/or TP53 mutation status (C), and GC status (D). P values are descriptive only. *Stratified analysis; unstratified HR, 0.21 (95% CI, 0.16, 0.27). †Unstratified analysis. +, censored.

