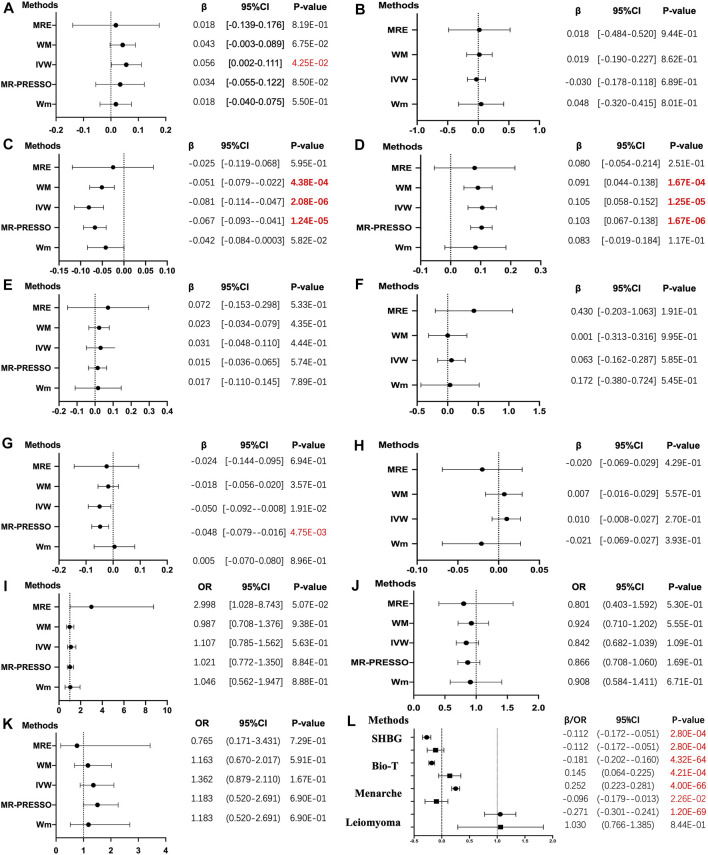
FIGURE 1.
The results of four different methods of Mendelian randomization (MR) analysis. (The MR analysis showing the effect of the exposure SNPs on the outcomes. (A–K): (A) body mass index, BMI; (B) estradiol, E2; (C) sex hormone-binding globulin, SHBG; (D) bioavailable testosterone, bio-T; (E) total testosterone, TT; (F) anti-Mullerian hormone, AMH; (G) menarche; (H) menopause; (I) endometriosis; (J) leiomyoma; (K) polycystic ovarian syndrome, PCOS. (L) in the multivariable MR analysis, each trait with two results is presented. The solid dot means the causal effects of LBW on traits, whereas the square means BMI on traits in the MVMR. MRE, MR-Egger; WM, weighted median; Wm, weighted mode; IVW, inverse variance weighting; MR-PRESSO, MR-Egger and Mendelian Randomization Pleiotropy RESidual Sum and Outlier. The results of the continuous outcomes are presented by β [95% CI], whereas the binary outcomes are shown by OR [95% CI]. Numbers in red mean p-values < 5.00E-02 and red and bold font means p-values < 4.55E-03)

