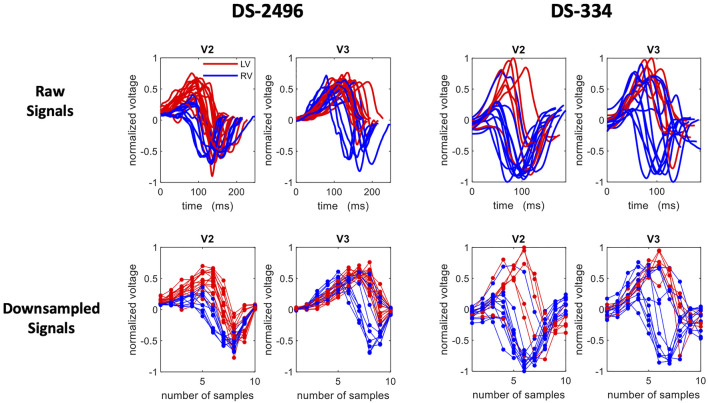
FIGURE 2.
A set of selected ECG traces from the simulated (DS-2496) and the DS-334 datasets. The extracted QRS of the V2 and V3 precordial leads are shown in the top row and their corresponding down-sampled traces (10 samples) in the bottom row. Right Ventricle (RV) signals are plotted in blue, whereas left ventricle (LV) signals are in red.

