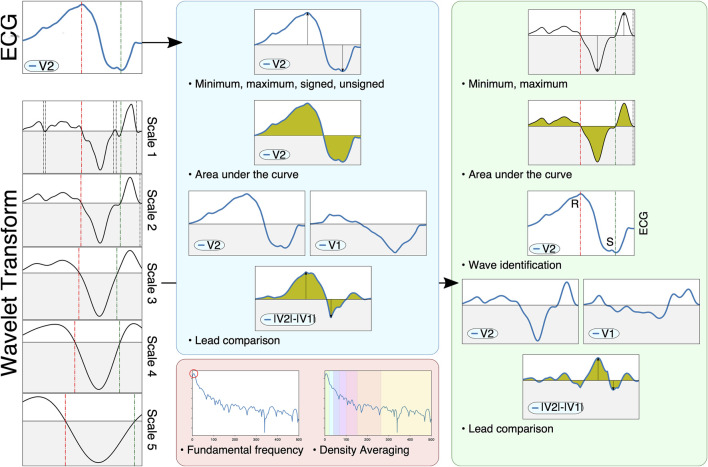
FIGURE 3.
Schematic representation of the feature extraction pipeline. The ECG (left, top) and its wavelet transform (left, scales one through 5) are used to compute signal-based (blue), wavelet-based (green) and spectral-based (red) features. Signal-based features measure the raw ECG, computing extrema, areas or characteristics computed through pairwise lead comparison. Wavelet-based features also compute said markers, but also identify important fiducials through zero-crossings (e.g. different QRS waves such as the R and S waves, shown on the left as green and red dotted lines). Finally, spectral information employs Welch’s periodogram to obtain features based on the signal’s power spectral density.

