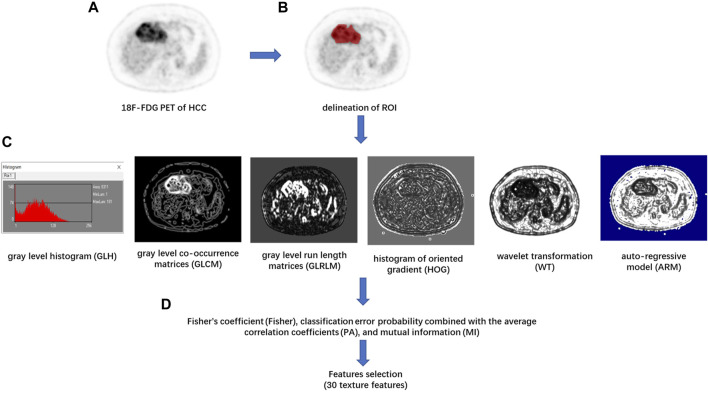
FIGURE 1.
Flowchart of texture features (TF) extraction. (A) The 18F-FDG PET image of the maximum axial section of hepatocellular carcinoma (HCC) was chosen. (B) The region of interest (ROI) of the tumor was drawn in red on MaZda. (C) The gray level histogram (GLH), gray level co-occurrence matrices (GLCM), gray level run length matrices (GLRLM), histogram of oriented gradient (HOG), wavelet transformation (WT), and the autoregressive model (ARM) of tumor were calculated, respectively. (D) A combination of feature selection algorithms, including Fisher’s coefficient (Fisher), classification error probability combined with the average correlation coefficients (PA), and mutual information (MI), was used to determine 30 texture features with the highest discriminative power for differentiation HCC with or without between mVI.

