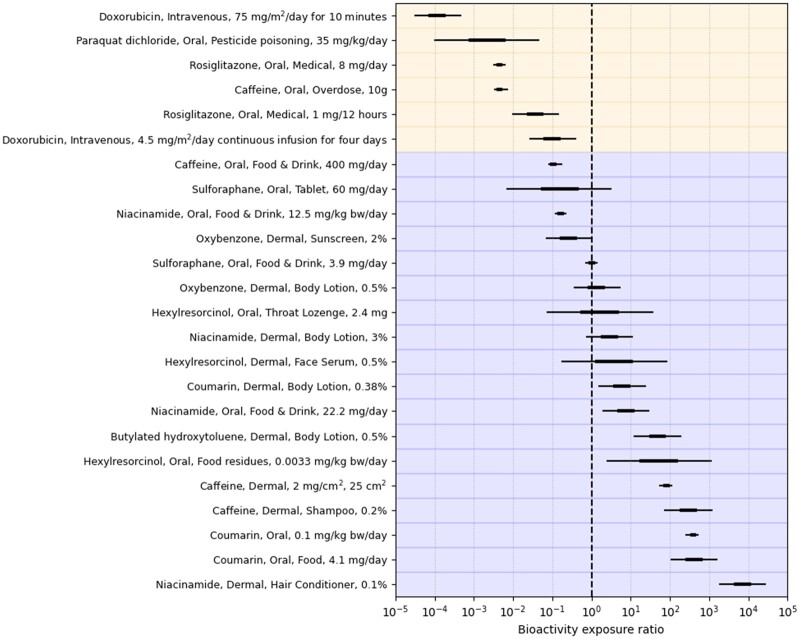
Figure 5.
Centered 50% and 95% credible intervals summarizing the distribution of the bioactivity exposure ratio (BER) when using all available predicted Cmax estimates. Background colors indicate the assigned risk category for each benchmark chemical-exposure scenario assigned at stage 1 (blue—low, yellow—high). The vertical dashed line indicates a BER equal to 1.

